29
/
en
AIzaSyAYiBZKx7MnpbEhh9jyipgxe19OcubqV5w
April 1, 2024
262056
Thailand
THA
true
2
1
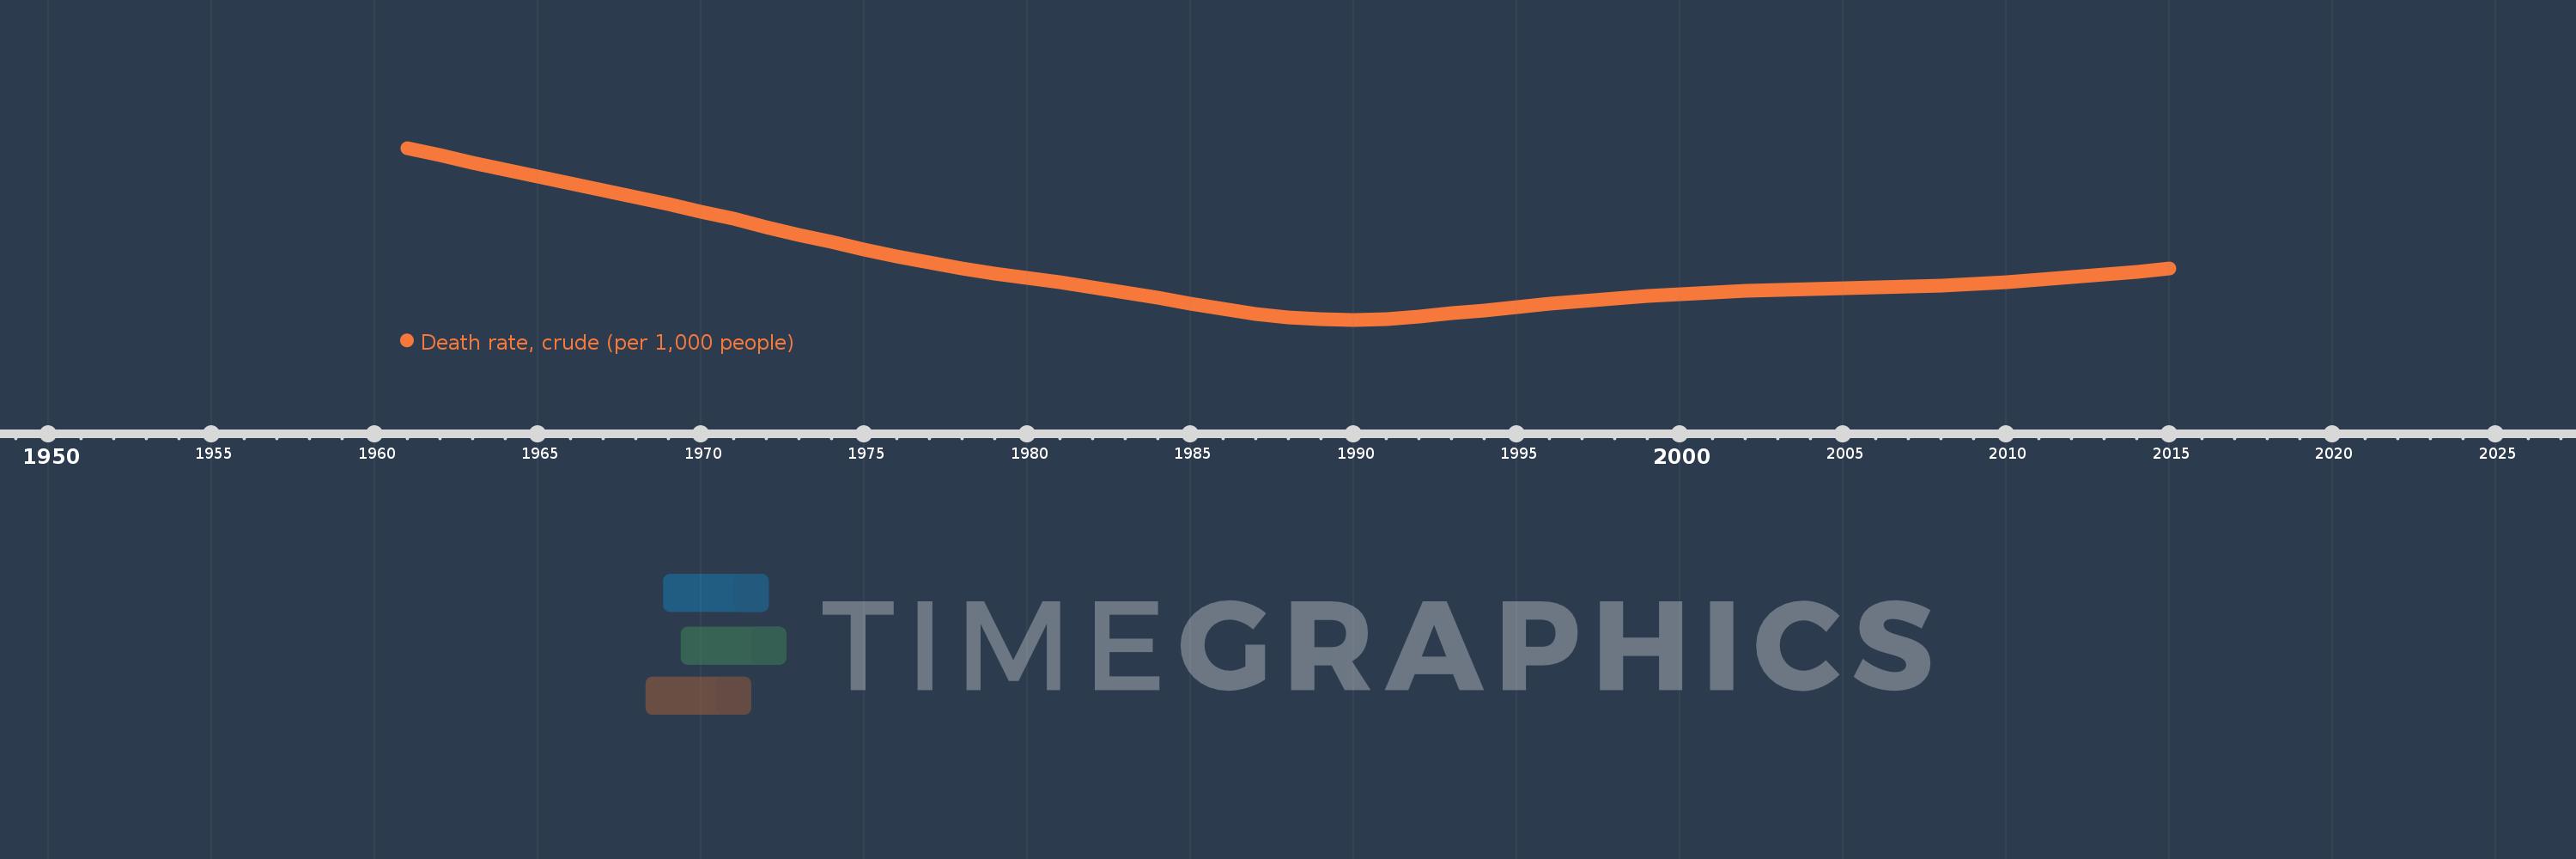
Death rate, crude (per 1,000 people)
2015,2014,2013,2012,2011,2010,2009,2008,2007,2006,2005,2004,2003,2002,2001,2000,1999,1998,1997,1996,1995,1994,1993,1992,1991,1990,1989,1988,1987,1986,1985,1984,1983,1982,1981,1980,1979,1978,1977,1976,1975,1974,1973,1972,1971,1970,1969,1968,1967,1966,1965,1964,1963,1962,1961
This statistics in other country:
AfghanistanAlbaniaAlgeriaAmerican SamoaAndorraAngolaAntigua and BarbudaArab WorldArgentinaArmeniaArubaAustraliaAustriaAzerbaijanBahamas, TheBahrainBangladeshBarbadosBelarusBelgiumBelizeBeninBermudaBhutanBoliviaBosnia and HerzegovinaBotswanaBrazilBrunei DarussalamBulgariaBurkina FasoBurundiCabo VerdeCambodiaCameroonCanadaCaribbean small statesCayman IslandsCentral African RepublicCentral Europe and the BalticsChadChannel IslandsChileChinaColombiaComorosCongo, Dem. Rep.Congo, Rep.Costa RicaCote d'IvoireCroatiaCubaCuracaoCyprusCzech RepublicDenmarkDjiboutiDominicaDominican RepublicEarly-demographic dividendEast Asia & PacificEast Asia & Pacific (excluding high income)East Asia & Pacific (IDA & IBRD countries)EcuadorEgypt, Arab Rep.El SalvadorEquatorial GuineaEritreaEstoniaEthiopiaEuro areaEurope & Central AsiaEurope & Central Asia (excluding high income)Europe & Central Asia (IDA & IBRD countries)European UnionFaroe IslandsFijiFinlandFragile and conflict affected situationsFranceFrench PolynesiaGabonGambia, TheGeorgiaGermanyGhanaGreeceGreenlandGrenadaGuamGuatemalaGuineaGuinea-BissauGuyanaHaitiHeavily indebted poor countries (HIPC)High incomeHondurasHong Kong SAR, ChinaHungaryIBRD onlyIcelandIDA & IBRD totalIDA blendIDA onlyIDA totalIndiaIndonesiaIran, Islamic Rep.IraqIrelandIsle of ManIsraelItalyJamaicaJapanJordanKazakhstanKenyaKiribatiKorea, Dem. People’s Rep.Korea, Rep.KosovoKuwaitKyrgyz RepublicLao PDRLate-demographic dividendLatin America & Caribbean Latin America & Caribbean (excluding high income)Latin America & the Caribbean (IDA & IBRD countries)LatviaLeast developed countries: UN classificationLebanonLesothoLiberiaLibyaLiechtensteinLithuaniaLow & middle incomeLow incomeLower middle incomeLuxembourgMacao SAR, ChinaMacedonia, FYRMadagascarMalawiMalaysiaMaldivesMaliMaltaMarshall IslandsMauritaniaMauritiusMexicoMicronesia, Fed. Sts.Middle East & North AfricaMiddle East & North Africa (excluding high income)Middle East & North Africa (IDA & IBRD countries)Middle incomeMoldovaMonacoMongoliaMontenegroMoroccoMozambiqueMyanmarNamibiaNepalNetherlandsNew CaledoniaNew ZealandNicaraguaNigerNigeriaNorth AmericaNorwayOECD membersOmanOther small statesPacific island small statesPakistanPalauPanamaPapua New GuineaParaguayPeruPhilippinesPolandPortugalPost-demographic dividendPre-demographic dividendPuerto RicoQatarRomaniaRussian FederationRwandaSamoaSan MarinoSao Tome and PrincipeSaudi ArabiaSenegalSerbiaSeychellesSierra LeoneSingaporeSint Maarten (Dutch part)Slovak RepublicSloveniaSmall statesSolomon IslandsSomaliaSouth AfricaSouth AsiaSouth Asia (IDA & IBRD)South SudanSpainSri LankaSt. Kitts and NevisSt. LuciaSt. Martin (French part)St. Vincent and the GrenadinesSub-Saharan Africa Sub-Saharan Africa (excluding high income)Sub-Saharan Africa (IDA & IBRD countries)SudanSurinameSwazilandSwedenSwitzerlandSyrian Arab RepublicTajikistanTanzaniaThailandTimor-LesteTogoTongaTrinidad and TobagoTunisiaTurkeyTurkmenistanUgandaUkraineUnited Arab EmiratesUnited KingdomUnited StatesUpper middle incomeUruguayUzbekistanVanuatuVenezuela, RBVietnamVirgin Islands (U.S.)West Bank and GazaWorldYemen, Rep.ZambiaZimbabwe Timeline:
This timeline shows a graph from 1961 to 2015 of Thailand. No data until 1960. Number of actual observations by date: 55.
Source name:
World Development Indicators
Source organization:
(1) United Nations Population Division. World Population Prospects, (2) Census reports and other statistical publications from national statistical offices, (3) Eurostat: Demographic Statistics, (4) United Nations Statistical Division. Population and Vital Statistics Reprot (various years), (5) U.S. Census Bureau: International Database, and (6) Secretariat of the Pacific Community: Statistics and Demography Programme.
Categories, topics:
Health
Last updated:
apr 23, 2017
Indicators value changes by year
At the date of observation
Value
Absolute change
Change from previous value
jan 1, 1961
13.18
+13.18
0.0%
jan 1, 1962
12.852
-0.328
-2.49%
jan 1, 1963
12.533
-0.319
-2.48%
jan 1, 1964
12.225
-0.308
-2.46%
jan 1, 1965
11.928
-0.297
-2.43%
jan 1, 1966
11.637
-0.291
-2.44%
jan 1, 1967
11.345
-0.292
-2.51%
jan 1, 1968
11.045
-0.3
-2.64%
jan 1, 1969
10.732
-0.313
-2.83%
jan 1, 1970
10.406
-0.326
-3.04%
jan 1, 1971
10.071
-0.335
-3.22%
jan 1, 1972
9.729
-0.342
-3.4%
jan 1, 1973
9.389
-0.34
-3.49%
jan 1, 1974
9.058
-0.331
-3.53%
jan 1, 1975
8.74
-0.318
-3.51%
jan 1, 1976
8.443
-0.297
-3.4%
jan 1, 1977
8.171
-0.272
-3.22%
jan 1, 1978
7.923
-0.248
-3.04%
jan 1, 1979
7.698
-0.225
-2.84%
jan 1, 1980
7.49
-0.208
-2.7%
jan 1, 1981
7.289
-0.201
-2.68%
jan 1, 1982
7.079
-0.21
-2.88%
jan 1, 1983
6.854
-0.225
-3.18%
jan 1, 1984
6.614
-0.24
-3.5%
jan 1, 1985
6.366
-0.248
-3.75%
jan 1, 1986
6.128
-0.238
-3.74%
jan 1, 1987
5.922
-0.206
-3.36%
jan 1, 1988
5.77
-0.152
-2.57%
jan 1, 1989
5.683
-0.087
-1.51%
jan 1, 1990
5.664
-0.019
-0.33%
jan 1, 1991
5.709
+0.045
0.79%
jan 1, 1992
5.808
+0.099
1.73%
jan 1, 1993
5.938
+0.13
2.24%
jan 1, 1994
6.081
+0.143
2.41%
jan 1, 1995
6.223
+0.142
2.34%
jan 1, 1996
6.357
+0.134
2.15%
jan 1, 1997
6.479
+0.122
1.92%
jan 1, 1998
6.592
+0.113
1.74%
jan 1, 1999
6.696
+0.104
1.58%
jan 1, 2000
6.791
+0.095
1.42%
jan 1, 2001
6.872
+0.081
1.19%
jan 1, 2002
6.935
+0.063
0.92%
jan 1, 2003
6.982
+0.047
0.68%
jan 1, 2004
7.017
+0.035
0.5%
jan 1, 2005
7.045
+0.028
0.4%
jan 1, 2006
7.072
+0.027
0.38%
jan 1, 2007
7.106
+0.034
0.48%
jan 1, 2008
7.153
+0.047
0.66%
jan 1, 2009
7.218
+0.065
0.91%
jan 1, 2010
7.303
+0.085
1.18%
jan 1, 2011
7.405
+0.102
1.4%
jan 1, 2012
7.522
+0.117
1.58%
jan 1, 2013
7.647
+0.125
1.66%
jan 1, 2014
7.774
+0.127
1.66%
jan 1, 2015
7.901
+0.127
1.63%
Ranking of countries by current statistics by years


Comments: