29
/
en
AIzaSyAYiBZKx7MnpbEhh9jyipgxe19OcubqV5w
April 1, 2024
265634
Tonga
TON
true
2
1
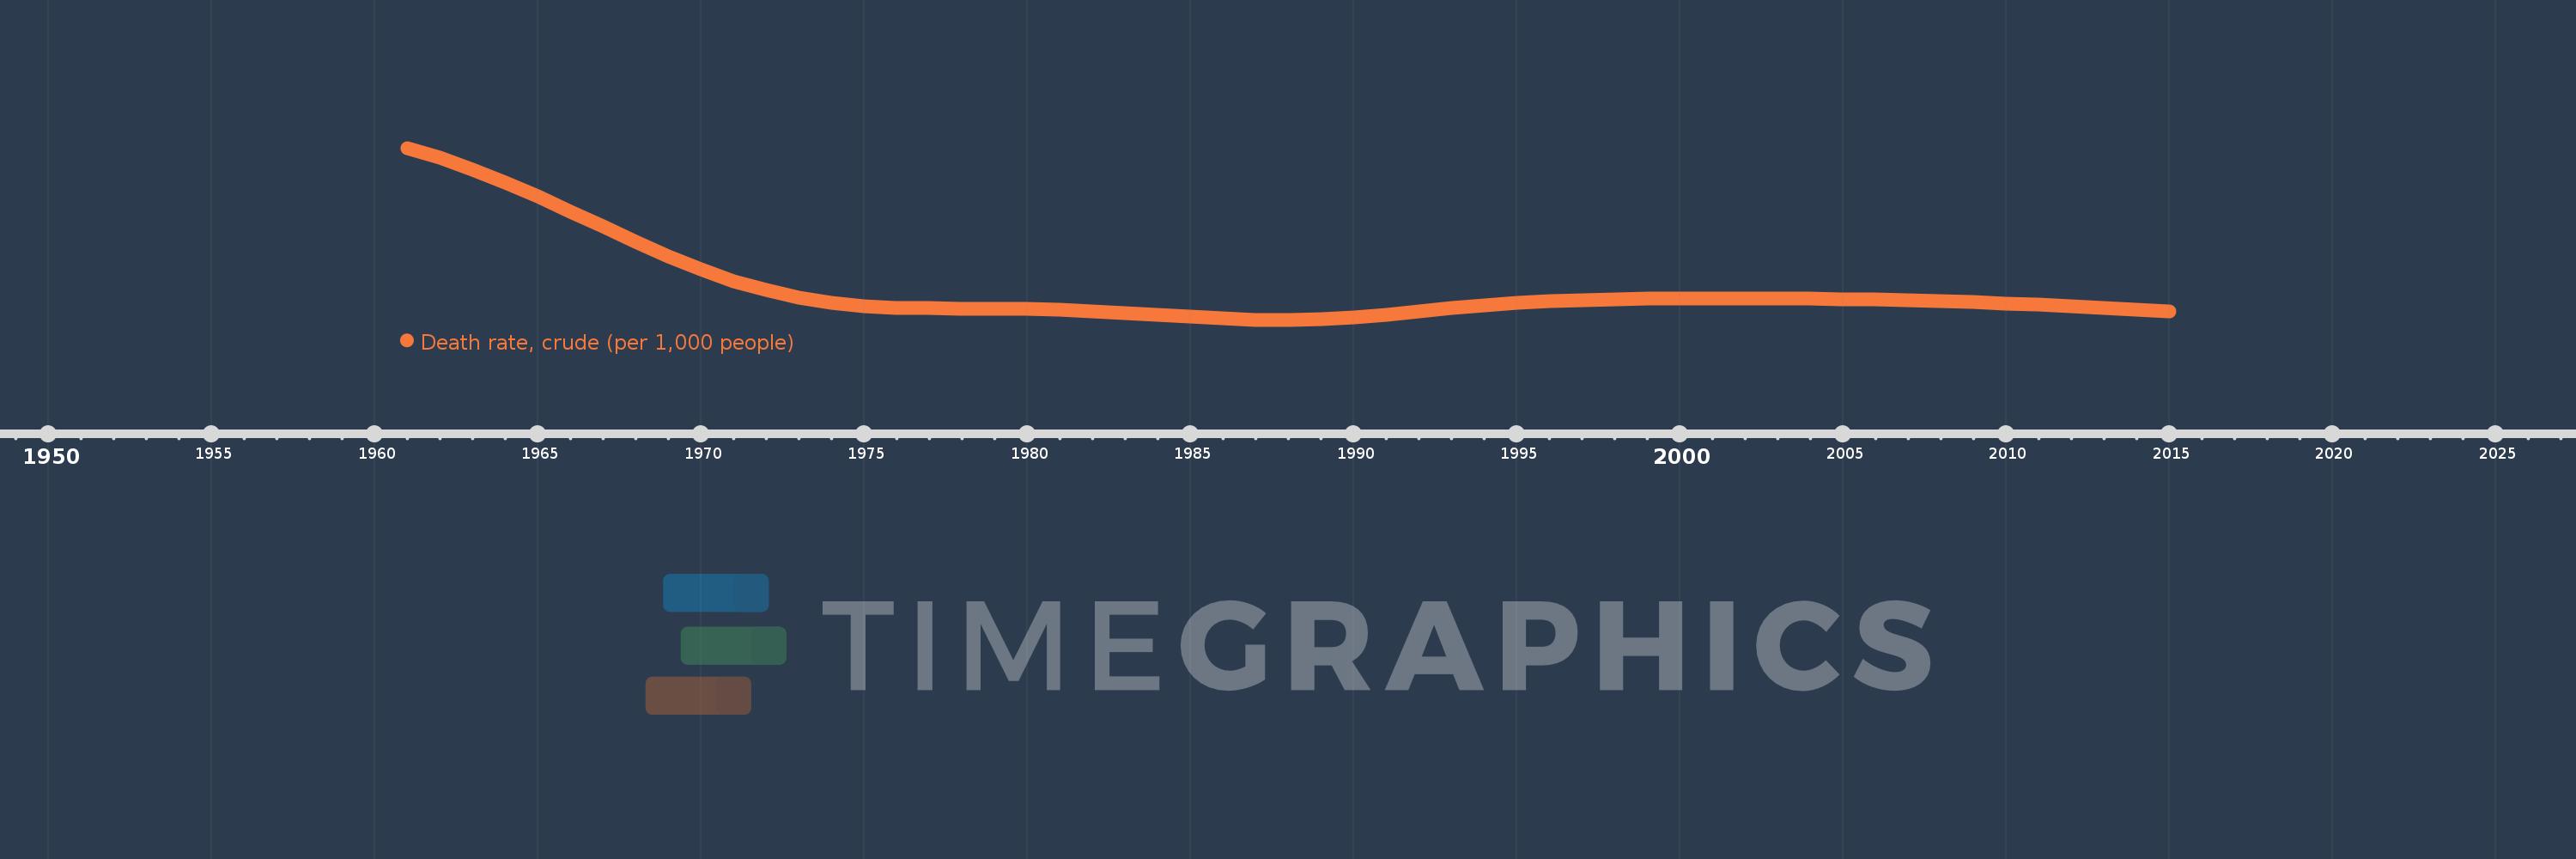
Death rate, crude (per 1,000 people)
2015,2014,2013,2012,2011,2010,2009,2008,2007,2006,2005,2004,2003,2002,2001,2000,1999,1998,1997,1996,1995,1994,1993,1992,1991,1990,1989,1988,1987,1986,1985,1984,1983,1982,1981,1980,1979,1978,1977,1976,1975,1974,1973,1972,1971,1970,1969,1968,1967,1966,1965,1964,1963,1962,1961
This statistics in other country:
AfghanistanAlbaniaAlgeriaAmerican SamoaAndorraAngolaAntigua and BarbudaArab WorldArgentinaArmeniaArubaAustraliaAustriaAzerbaijanBahamas, TheBahrainBangladeshBarbadosBelarusBelgiumBelizeBeninBermudaBhutanBoliviaBosnia and HerzegovinaBotswanaBrazilBrunei DarussalamBulgariaBurkina FasoBurundiCabo VerdeCambodiaCameroonCanadaCaribbean small statesCayman IslandsCentral African RepublicCentral Europe and the BalticsChadChannel IslandsChileChinaColombiaComorosCongo, Dem. Rep.Congo, Rep.Costa RicaCote d'IvoireCroatiaCubaCuracaoCyprusCzech RepublicDenmarkDjiboutiDominicaDominican RepublicEarly-demographic dividendEast Asia & PacificEast Asia & Pacific (excluding high income)East Asia & Pacific (IDA & IBRD countries)EcuadorEgypt, Arab Rep.El SalvadorEquatorial GuineaEritreaEstoniaEthiopiaEuro areaEurope & Central AsiaEurope & Central Asia (excluding high income)Europe & Central Asia (IDA & IBRD countries)European UnionFaroe IslandsFijiFinlandFragile and conflict affected situationsFranceFrench PolynesiaGabonGambia, TheGeorgiaGermanyGhanaGreeceGreenlandGrenadaGuamGuatemalaGuineaGuinea-BissauGuyanaHaitiHeavily indebted poor countries (HIPC)High incomeHondurasHong Kong SAR, ChinaHungaryIBRD onlyIcelandIDA & IBRD totalIDA blendIDA onlyIDA totalIndiaIndonesiaIran, Islamic Rep.IraqIrelandIsle of ManIsraelItalyJamaicaJapanJordanKazakhstanKenyaKiribatiKorea, Dem. People’s Rep.Korea, Rep.KosovoKuwaitKyrgyz RepublicLao PDRLate-demographic dividendLatin America & Caribbean Latin America & Caribbean (excluding high income)Latin America & the Caribbean (IDA & IBRD countries)LatviaLeast developed countries: UN classificationLebanonLesothoLiberiaLibyaLiechtensteinLithuaniaLow & middle incomeLow incomeLower middle incomeLuxembourgMacao SAR, ChinaMacedonia, FYRMadagascarMalawiMalaysiaMaldivesMaliMaltaMarshall IslandsMauritaniaMauritiusMexicoMicronesia, Fed. Sts.Middle East & North AfricaMiddle East & North Africa (excluding high income)Middle East & North Africa (IDA & IBRD countries)Middle incomeMoldovaMonacoMongoliaMontenegroMoroccoMozambiqueMyanmarNamibiaNepalNetherlandsNew CaledoniaNew ZealandNicaraguaNigerNigeriaNorth AmericaNorwayOECD membersOmanOther small statesPacific island small statesPakistanPalauPanamaPapua New GuineaParaguayPeruPhilippinesPolandPortugalPost-demographic dividendPre-demographic dividendPuerto RicoQatarRomaniaRussian FederationRwandaSamoaSan MarinoSao Tome and PrincipeSaudi ArabiaSenegalSerbiaSeychellesSierra LeoneSingaporeSint Maarten (Dutch part)Slovak RepublicSloveniaSmall statesSolomon IslandsSomaliaSouth AfricaSouth AsiaSouth Asia (IDA & IBRD)South SudanSpainSri LankaSt. Kitts and NevisSt. LuciaSt. Martin (French part)St. Vincent and the GrenadinesSub-Saharan Africa Sub-Saharan Africa (excluding high income)Sub-Saharan Africa (IDA & IBRD countries)SudanSurinameSwazilandSwedenSwitzerlandSyrian Arab RepublicTajikistanTanzaniaThailandTimor-LesteTogoTongaTrinidad and TobagoTunisiaTurkeyTurkmenistanUgandaUkraineUnited Arab EmiratesUnited KingdomUnited StatesUpper middle incomeUruguayUzbekistanVanuatuVenezuela, RBVietnamVirgin Islands (U.S.)West Bank and GazaWorldYemen, Rep.ZambiaZimbabwe Timeline:
This timeline shows a graph from 1961 to 2015 of Tonga. No data until 1960. Number of actual observations by date: 55.
Source name:
World Development Indicators
Source organization:
(1) United Nations Population Division. World Population Prospects, (2) Census reports and other statistical publications from national statistical offices, (3) Eurostat: Demographic Statistics, (4) United Nations Statistical Division. Population and Vital Statistics Reprot (various years), (5) U.S. Census Bureau: International Database, and (6) Secretariat of the Pacific Community: Statistics and Demography Programme.
Categories, topics:
Health
Last updated:
apr 23, 2017
Indicators value changes by year
At the date of observation
Value
Absolute change
Change from previous value
jan 1, 1961
9.034
+9.034
0.0%
jan 1, 1962
8.853
-0.181
-2.0%
jan 1, 1963
8.64
-0.213
-2.41%
jan 1, 1964
8.399
-0.241
-2.79%
jan 1, 1965
8.136
-0.263
-3.13%
jan 1, 1966
7.861
-0.275
-3.38%
jan 1, 1967
7.58
-0.281
-3.57%
jan 1, 1968
7.302
-0.278
-3.67%
jan 1, 1969
7.037
-0.265
-3.63%
jan 1, 1970
6.793
-0.244
-3.47%
jan 1, 1971
6.581
-0.212
-3.12%
jan 1, 1972
6.41
-0.171
-2.6%
jan 1, 1973
6.279
-0.131
-2.04%
jan 1, 1974
6.184
-0.095
-1.51%
jan 1, 1975
6.122
-0.062
-1.0%
jan 1, 1976
6.089
-0.033
-0.54%
jan 1, 1977
6.076
-0.013
-0.21%
jan 1, 1978
6.074
-0.002
-0.03%
jan 1, 1979
6.073
-0.001
-0.02%
jan 1, 1980
6.068
-0.005
-0.08%
jan 1, 1981
6.053
-0.015
-0.25%
jan 1, 1982
6.027
-0.026
-0.43%
jan 1, 1983
5.994
-0.033
-0.55%
jan 1, 1984
5.956
-0.038
-0.63%
jan 1, 1985
5.919
-0.037
-0.62%
jan 1, 1986
5.887
-0.032
-0.54%
jan 1, 1987
5.868
-0.019
-0.32%
jan 1, 1988
5.866
-0.002
-0.03%
jan 1, 1989
5.881
+0.015
0.26%
jan 1, 1990
5.915
+0.034
0.58%
jan 1, 1991
5.963
+0.048
0.81%
jan 1, 1992
6.019
+0.056
0.94%
jan 1, 1993
6.076
+0.057
0.95%
jan 1, 1994
6.128
+0.052
0.86%
jan 1, 1995
6.171
+0.043
0.7%
jan 1, 1996
6.204
+0.033
0.53%
jan 1, 1997
6.226
+0.022
0.35%
jan 1, 1998
6.241
+0.015
0.24%
jan 1, 1999
6.251
+0.01
0.16%
jan 1, 2000
6.257
+0.006
0.1%
jan 1, 2001
6.26
+0.003
0.05%
jan 1, 2003
6.259
-0.001
-0.02%
jan 1, 2004
6.255
-0.004
-0.06%
jan 1, 2005
6.249
-0.006
-0.1%
jan 1, 2006
6.24
-0.009
-0.14%
jan 1, 2007
6.228
-0.012
-0.19%
jan 1, 2008
6.212
-0.016
-0.26%
jan 1, 2009
6.192
-0.02
-0.32%
jan 1, 2010
6.168
-0.024
-0.39%
jan 1, 2011
6.141
-0.027
-0.44%
jan 1, 2012
6.111
-0.03
-0.49%
jan 1, 2013
6.08
-0.031
-0.51%
jan 1, 2014
6.048
-0.032
-0.53%
jan 1, 2015
6.016
-0.032
-0.53%
Ranking of countries by current statistics by years


Comments: