29
/
en
AIzaSyAYiBZKx7MnpbEhh9jyipgxe19OcubqV5w
April 1, 2024
128165
Eritrea
ERI
true
2
1
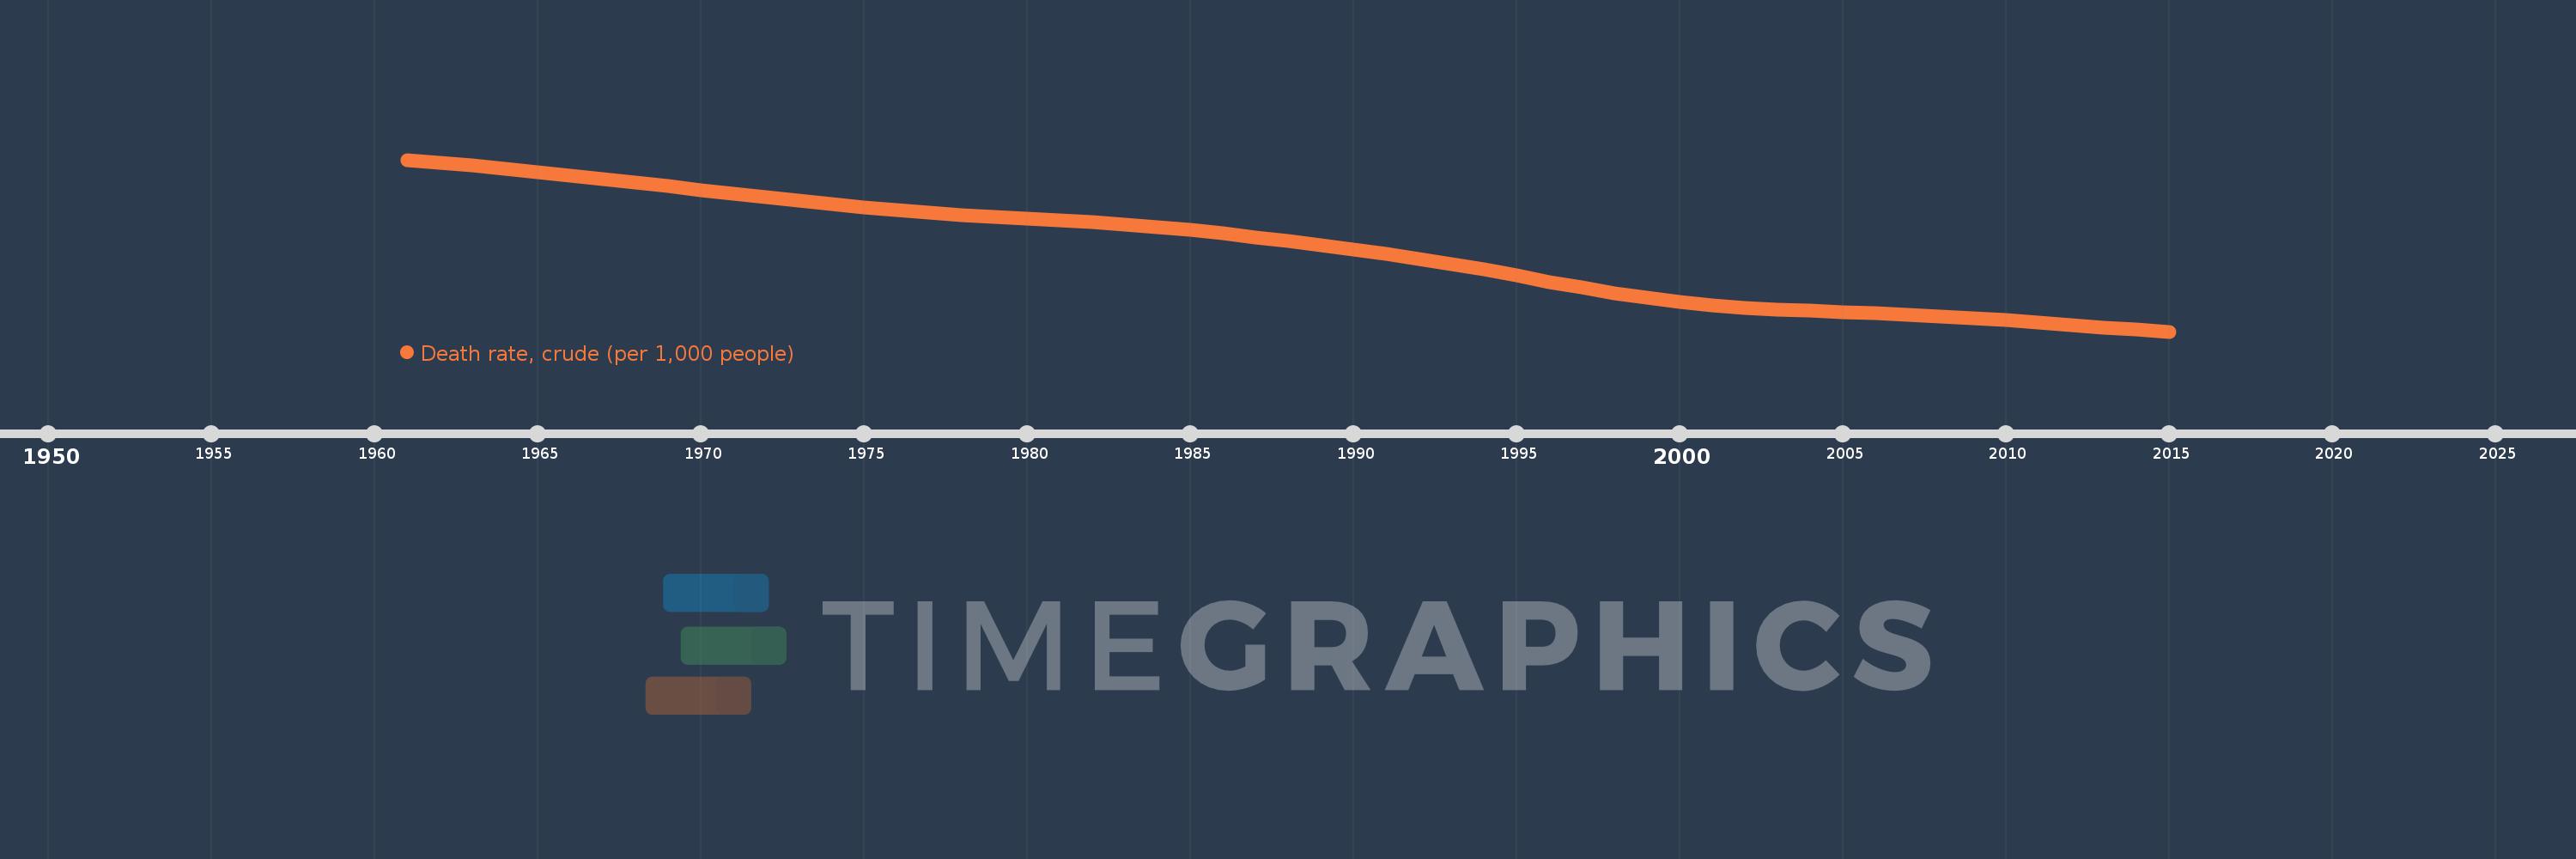
Death rate, crude (per 1,000 people)
2015,2014,2013,2012,2011,2010,2009,2008,2007,2006,2005,2004,2003,2002,2001,2000,1999,1998,1997,1996,1995,1994,1993,1992,1991,1990,1989,1988,1987,1986,1985,1984,1983,1982,1981,1980,1979,1978,1977,1976,1975,1974,1973,1972,1971,1970,1969,1968,1967,1966,1965,1964,1963,1962,1961
This statistics in other country:
AfghanistanAlbaniaAlgeriaAmerican SamoaAndorraAngolaAntigua and BarbudaArab WorldArgentinaArmeniaArubaAustraliaAustriaAzerbaijanBahamas, TheBahrainBangladeshBarbadosBelarusBelgiumBelizeBeninBermudaBhutanBoliviaBosnia and HerzegovinaBotswanaBrazilBrunei DarussalamBulgariaBurkina FasoBurundiCabo VerdeCambodiaCameroonCanadaCaribbean small statesCayman IslandsCentral African RepublicCentral Europe and the BalticsChadChannel IslandsChileChinaColombiaComorosCongo, Dem. Rep.Congo, Rep.Costa RicaCote d'IvoireCroatiaCubaCuracaoCyprusCzech RepublicDenmarkDjiboutiDominicaDominican RepublicEarly-demographic dividendEast Asia & PacificEast Asia & Pacific (excluding high income)East Asia & Pacific (IDA & IBRD countries)EcuadorEgypt, Arab Rep.El SalvadorEquatorial GuineaEritreaEstoniaEthiopiaEuro areaEurope & Central AsiaEurope & Central Asia (excluding high income)Europe & Central Asia (IDA & IBRD countries)European UnionFaroe IslandsFijiFinlandFragile and conflict affected situationsFranceFrench PolynesiaGabonGambia, TheGeorgiaGermanyGhanaGreeceGreenlandGrenadaGuamGuatemalaGuineaGuinea-BissauGuyanaHaitiHeavily indebted poor countries (HIPC)High incomeHondurasHong Kong SAR, ChinaHungaryIBRD onlyIcelandIDA & IBRD totalIDA blendIDA onlyIDA totalIndiaIndonesiaIran, Islamic Rep.IraqIrelandIsle of ManIsraelItalyJamaicaJapanJordanKazakhstanKenyaKiribatiKorea, Dem. People’s Rep.Korea, Rep.KosovoKuwaitKyrgyz RepublicLao PDRLate-demographic dividendLatin America & Caribbean Latin America & Caribbean (excluding high income)Latin America & the Caribbean (IDA & IBRD countries)LatviaLeast developed countries: UN classificationLebanonLesothoLiberiaLibyaLiechtensteinLithuaniaLow & middle incomeLow incomeLower middle incomeLuxembourgMacao SAR, ChinaMacedonia, FYRMadagascarMalawiMalaysiaMaldivesMaliMaltaMarshall IslandsMauritaniaMauritiusMexicoMicronesia, Fed. Sts.Middle East & North AfricaMiddle East & North Africa (excluding high income)Middle East & North Africa (IDA & IBRD countries)Middle incomeMoldovaMonacoMongoliaMontenegroMoroccoMozambiqueMyanmarNamibiaNepalNetherlandsNew CaledoniaNew ZealandNicaraguaNigerNigeriaNorth AmericaNorwayOECD membersOmanOther small statesPacific island small statesPakistanPalauPanamaPapua New GuineaParaguayPeruPhilippinesPolandPortugalPost-demographic dividendPre-demographic dividendPuerto RicoQatarRomaniaRussian FederationRwandaSamoaSan MarinoSao Tome and PrincipeSaudi ArabiaSenegalSerbiaSeychellesSierra LeoneSingaporeSint Maarten (Dutch part)Slovak RepublicSloveniaSmall statesSolomon IslandsSomaliaSouth AfricaSouth AsiaSouth Asia (IDA & IBRD)South SudanSpainSri LankaSt. Kitts and NevisSt. LuciaSt. Martin (French part)St. Vincent and the GrenadinesSub-Saharan Africa Sub-Saharan Africa (excluding high income)Sub-Saharan Africa (IDA & IBRD countries)SudanSurinameSwazilandSwedenSwitzerlandSyrian Arab RepublicTajikistanTanzaniaThailandTimor-LesteTogoTongaTrinidad and TobagoTunisiaTurkeyTurkmenistanUgandaUkraineUnited Arab EmiratesUnited KingdomUnited StatesUpper middle incomeUruguayUzbekistanVanuatuVenezuela, RBVietnamVirgin Islands (U.S.)West Bank and GazaWorldYemen, Rep.ZambiaZimbabwe Timeline:
This timeline shows a graph from 1961 to 2015 of Eritrea. No data until 1960. Number of actual observations by date: 55.
Source name:
World Development Indicators
Source organization:
(1) United Nations Population Division. World Population Prospects, (2) Census reports and other statistical publications from national statistical offices, (3) Eurostat: Demographic Statistics, (4) United Nations Statistical Division. Population and Vital Statistics Reprot (various years), (5) U.S. Census Bureau: International Database, and (6) Secretariat of the Pacific Community: Statistics and Demography Programme.
Categories, topics:
Health
Last updated:
apr 23, 2017
Indicators value changes by year
Maximum:
25.356
jan 1, 1961
At the date of observation
Value
Absolute change
Change from previous value
jan 1, 1961
25.356
+25.356
0.0%
jan 1, 1962
25.034
-0.322
-1.27%
jan 1, 1963
24.706
-0.328
-1.31%
jan 1, 1964
24.369
-0.337
-1.36%
jan 1, 1965
24.02
-0.349
-1.43%
jan 1, 1966
23.657
-0.363
-1.51%
jan 1, 1967
23.276
-0.381
-1.61%
jan 1, 1968
22.88
-0.396
-1.7%
jan 1, 1969
22.473
-0.407
-1.78%
jan 1, 1970
22.061
-0.412
-1.83%
jan 1, 1971
21.65
-0.411
-1.86%
jan 1, 1972
21.247
-0.403
-1.86%
jan 1, 1973
20.859
-0.388
-1.83%
jan 1, 1974
20.492
-0.367
-1.76%
jan 1, 1975
20.151
-0.341
-1.66%
jan 1, 1976
19.842
-0.309
-1.53%
jan 1, 1977
19.571
-0.271
-1.37%
jan 1, 1978
19.336
-0.235
-1.2%
jan 1, 1979
19.126
-0.21
-1.09%
jan 1, 1980
18.931
-0.195
-1.02%
jan 1, 1981
18.737
-0.194
-1.02%
jan 1, 1982
18.525
-0.212
-1.13%
jan 1, 1983
18.282
-0.243
-1.31%
jan 1, 1984
17.998
-0.284
-1.55%
jan 1, 1985
17.668
-0.33
-1.83%
jan 1, 1986
17.294
-0.374
-2.12%
jan 1, 1987
16.885
-0.409
-2.36%
jan 1, 1988
16.455
-0.43
-2.55%
jan 1, 1989
16.011
-0.444
-2.7%
jan 1, 1990
15.555
-0.456
-2.85%
jan 1, 1991
15.074
-0.481
-3.09%
jan 1, 1992
14.551
-0.523
-3.47%
jan 1, 1993
13.977
-0.574
-3.94%
jan 1, 1994
13.356
-0.621
-4.44%
jan 1, 1995
12.7
-0.656
-4.91%
jan 1, 1996
12.036
-0.664
-5.23%
jan 1, 1997
11.393
-0.643
-5.34%
jan 1, 1998
10.799
-0.594
-5.21%
jan 1, 1999
10.277
-0.522
-4.83%
jan 1, 2000
9.837
-0.44
-4.28%
jan 1, 2001
9.485
-0.352
-3.58%
jan 1, 2002
9.218
-0.267
-2.81%
jan 1, 2003
9.014
-0.204
-2.21%
jan 1, 2004
8.849
-0.165
-1.83%
jan 1, 2005
8.707
-0.142
-1.6%
jan 1, 2006
8.569
-0.138
-1.58%
jan 1, 2007
8.417
-0.152
-1.77%
jan 1, 2008
8.243
-0.174
-2.07%
jan 1, 2009
8.044
-0.199
-2.41%
jan 1, 2010
7.818
-0.226
-2.81%
jan 1, 2011
7.569
-0.249
-3.18%
jan 1, 2012
7.308
-0.261
-3.45%
jan 1, 2013
7.052
-0.256
-3.5%
jan 1, 2014
6.813
-0.239
-3.39%
jan 1, 2015
6.598
-0.215
-3.16%
Ranking of countries by current statistics by years


Comments: