29
/
en
AIzaSyAYiBZKx7MnpbEhh9jyipgxe19OcubqV5w
April 1, 2024
31455
Europe & Central Asia (excluding high income)
ECA
false
2
1
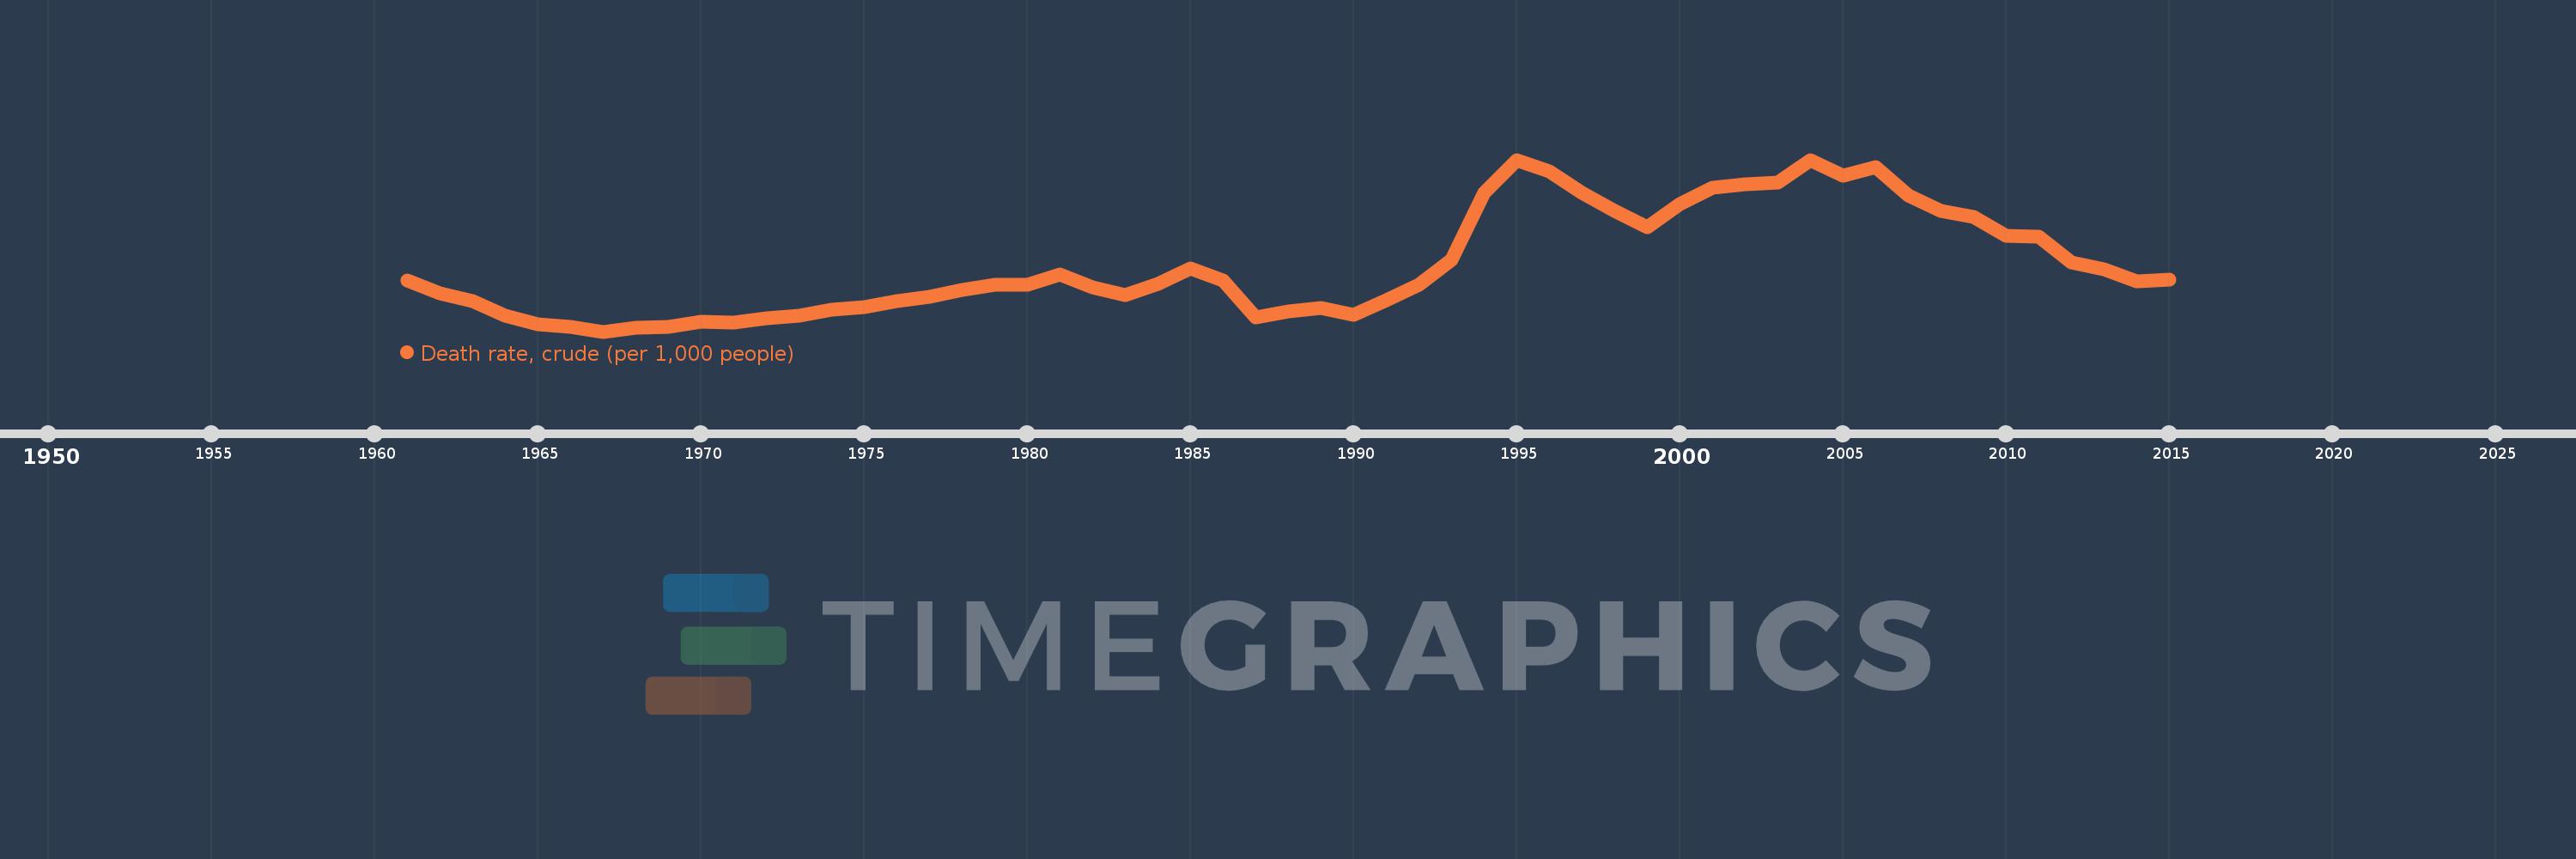
Death rate, crude (per 1,000 people)
2015,2014,2013,2012,2011,2010,2009,2008,2007,2006,2005,2004,2003,2002,2001,2000,1999,1998,1997,1996,1995,1994,1993,1992,1991,1990,1989,1988,1987,1986,1985,1984,1983,1982,1981,1980,1979,1978,1977,1976,1975,1974,1973,1972,1971,1970,1969,1968,1967,1966,1965,1964,1963,1962,1961
This statistics in other country:
AfghanistanAlbaniaAlgeriaAmerican SamoaAndorraAngolaAntigua and BarbudaArab WorldArgentinaArmeniaArubaAustraliaAustriaAzerbaijanBahamas, TheBahrainBangladeshBarbadosBelarusBelgiumBelizeBeninBermudaBhutanBoliviaBosnia and HerzegovinaBotswanaBrazilBrunei DarussalamBulgariaBurkina FasoBurundiCabo VerdeCambodiaCameroonCanadaCaribbean small statesCayman IslandsCentral African RepublicCentral Europe and the BalticsChadChannel IslandsChileChinaColombiaComorosCongo, Dem. Rep.Congo, Rep.Costa RicaCote d'IvoireCroatiaCubaCuracaoCyprusCzech RepublicDenmarkDjiboutiDominicaDominican RepublicEarly-demographic dividendEast Asia & PacificEast Asia & Pacific (excluding high income)East Asia & Pacific (IDA & IBRD countries)EcuadorEgypt, Arab Rep.El SalvadorEquatorial GuineaEritreaEstoniaEthiopiaEuro areaEurope & Central AsiaEurope & Central Asia (excluding high income)Europe & Central Asia (IDA & IBRD countries)European UnionFaroe IslandsFijiFinlandFragile and conflict affected situationsFranceFrench PolynesiaGabonGambia, TheGeorgiaGermanyGhanaGreeceGreenlandGrenadaGuamGuatemalaGuineaGuinea-BissauGuyanaHaitiHeavily indebted poor countries (HIPC)High incomeHondurasHong Kong SAR, ChinaHungaryIBRD onlyIcelandIDA & IBRD totalIDA blendIDA onlyIDA totalIndiaIndonesiaIran, Islamic Rep.IraqIrelandIsle of ManIsraelItalyJamaicaJapanJordanKazakhstanKenyaKiribatiKorea, Dem. People’s Rep.Korea, Rep.KosovoKuwaitKyrgyz RepublicLao PDRLate-demographic dividendLatin America & Caribbean Latin America & Caribbean (excluding high income)Latin America & the Caribbean (IDA & IBRD countries)LatviaLeast developed countries: UN classificationLebanonLesothoLiberiaLibyaLiechtensteinLithuaniaLow & middle incomeLow incomeLower middle incomeLuxembourgMacao SAR, ChinaMacedonia, FYRMadagascarMalawiMalaysiaMaldivesMaliMaltaMarshall IslandsMauritaniaMauritiusMexicoMicronesia, Fed. Sts.Middle East & North AfricaMiddle East & North Africa (excluding high income)Middle East & North Africa (IDA & IBRD countries)Middle incomeMoldovaMonacoMongoliaMontenegroMoroccoMozambiqueMyanmarNamibiaNepalNetherlandsNew CaledoniaNew ZealandNicaraguaNigerNigeriaNorth AmericaNorwayOECD membersOmanOther small statesPacific island small statesPakistanPalauPanamaPapua New GuineaParaguayPeruPhilippinesPolandPortugalPost-demographic dividendPre-demographic dividendPuerto RicoQatarRomaniaRussian FederationRwandaSamoaSan MarinoSao Tome and PrincipeSaudi ArabiaSenegalSerbiaSeychellesSierra LeoneSingaporeSint Maarten (Dutch part)Slovak RepublicSloveniaSmall statesSolomon IslandsSomaliaSouth AfricaSouth AsiaSouth Asia (IDA & IBRD)South SudanSpainSri LankaSt. Kitts and NevisSt. LuciaSt. Martin (French part)St. Vincent and the GrenadinesSub-Saharan Africa Sub-Saharan Africa (excluding high income)Sub-Saharan Africa (IDA & IBRD countries)SudanSurinameSwazilandSwedenSwitzerlandSyrian Arab RepublicTajikistanTanzaniaThailandTimor-LesteTogoTongaTrinidad and TobagoTunisiaTurkeyTurkmenistanUgandaUkraineUnited Arab EmiratesUnited KingdomUnited StatesUpper middle incomeUruguayUzbekistanVanuatuVenezuela, RBVietnamVirgin Islands (U.S.)West Bank and GazaWorldYemen, Rep.ZambiaZimbabwe Timeline:
This timeline shows a graph from 1961 to 2015 of Europe & Central Asia (excluding high income). No data until 1960. Number of actual observations by date: 55.
Source name:
World Development Indicators
Source organization:
(1) United Nations Population Division. World Population Prospects, (2) Census reports and other statistical publications from national statistical offices, (3) Eurostat: Demographic Statistics, (4) United Nations Statistical Division. Population and Vital Statistics Reprot (various years), (5) U.S. Census Bureau: International Database, and (6) Secretariat of the Pacific Community: Statistics and Demography Programme.
Categories, topics:
Health
Last updated:
apr 23, 2017
Indicators value changes by year
Maximum:
12.296
jan 1, 1995
At the date of observation
Value
Absolute change
Change from previous value
jan 1, 1961
10.382
+10.382
0.0%
jan 1, 1962
10.168
-0.214
-2.06%
jan 1, 1963
10.047
-0.121
-1.19%
jan 1, 1964
9.823
-0.223
-2.22%
jan 1, 1965
9.685
-0.139
-1.41%
jan 1, 1966
9.64
-0.045
-0.46%
jan 1, 1967
9.564
-0.076
-0.79%
jan 1, 1968
9.625
+0.061
0.64%
jan 1, 1969
9.633
+0.008
0.08%
jan 1, 1970
9.718
+0.085
0.88%
jan 1, 1971
9.704
-0.014
-0.15%
jan 1, 1972
9.772
+0.068
0.7%
jan 1, 1973
9.817
+0.045
0.46%
jan 1, 1974
9.918
+0.101
1.02%
jan 1, 1975
9.953
+0.035
0.35%
jan 1, 1976
10.054
+0.102
1.02%
jan 1, 1977
10.118
+0.064
0.63%
jan 1, 1978
10.221
+0.103
1.02%
jan 1, 1979
10.306
+0.085
0.83%
jan 1, 1980
10.304
-0.002
-0.02%
jan 1, 1981
10.472
+0.169
1.64%
jan 1, 1982
10.263
-0.21
-2.0%
jan 1, 1983
10.143
-0.12
-1.17%
jan 1, 1984
10.324
+0.181
1.79%
jan 1, 1985
10.564
+0.24
2.33%
jan 1, 1986
10.37
-0.194
-1.84%
jan 1, 1987
9.796
-0.574
-5.53%
jan 1, 1988
9.881
+0.085
0.86%
jan 1, 1989
9.946
+0.065
0.66%
jan 1, 1990
9.83
-0.116
-1.16%
jan 1, 1991
10.067
+0.236
2.4%
jan 1, 1992
10.309
+0.243
2.41%
jan 1, 1993
10.705
+0.396
3.84%
jan 1, 1994
11.764
+1.06
9.9%
jan 1, 1995
12.296
+0.531
4.51%
jan 1, 1996
12.112
-0.184
-1.5%
jan 1, 1997
11.764
-0.347
-2.87%
jan 1, 1998
11.487
-0.277
-2.35%
jan 1, 1999
11.223
-0.264
-2.3%
jan 1, 2000
11.59
+0.367
3.27%
jan 1, 2001
11.856
+0.266
2.29%
jan 1, 2002
11.905
+0.049
0.41%
jan 1, 2003
11.935
+0.03
0.25%
jan 1, 2004
12.284
+0.349
2.92%
jan 1, 2005
12.042
-0.242
-1.97%
jan 1, 2006
12.174
+0.132
1.1%
jan 1, 2007
11.735
-0.44
-3.61%
jan 1, 2008
11.483
-0.252
-2.14%
jan 1, 2009
11.387
-0.096
-0.83%
jan 1, 2010
11.085
-0.303
-2.66%
jan 1, 2011
11.067
-0.017
-0.16%
jan 1, 2012
10.669
-0.398
-3.6%
jan 1, 2013
10.553
-0.116
-1.08%
jan 1, 2014
10.36
-0.193
-1.83%
jan 1, 2015
10.392
+0.033
0.32%
Ranking of countries by current statistics by years


Comments: