29
/
en
AIzaSyAYiBZKx7MnpbEhh9jyipgxe19OcubqV5w
April 1, 2024
103457
Chad
TCD
true
2
1
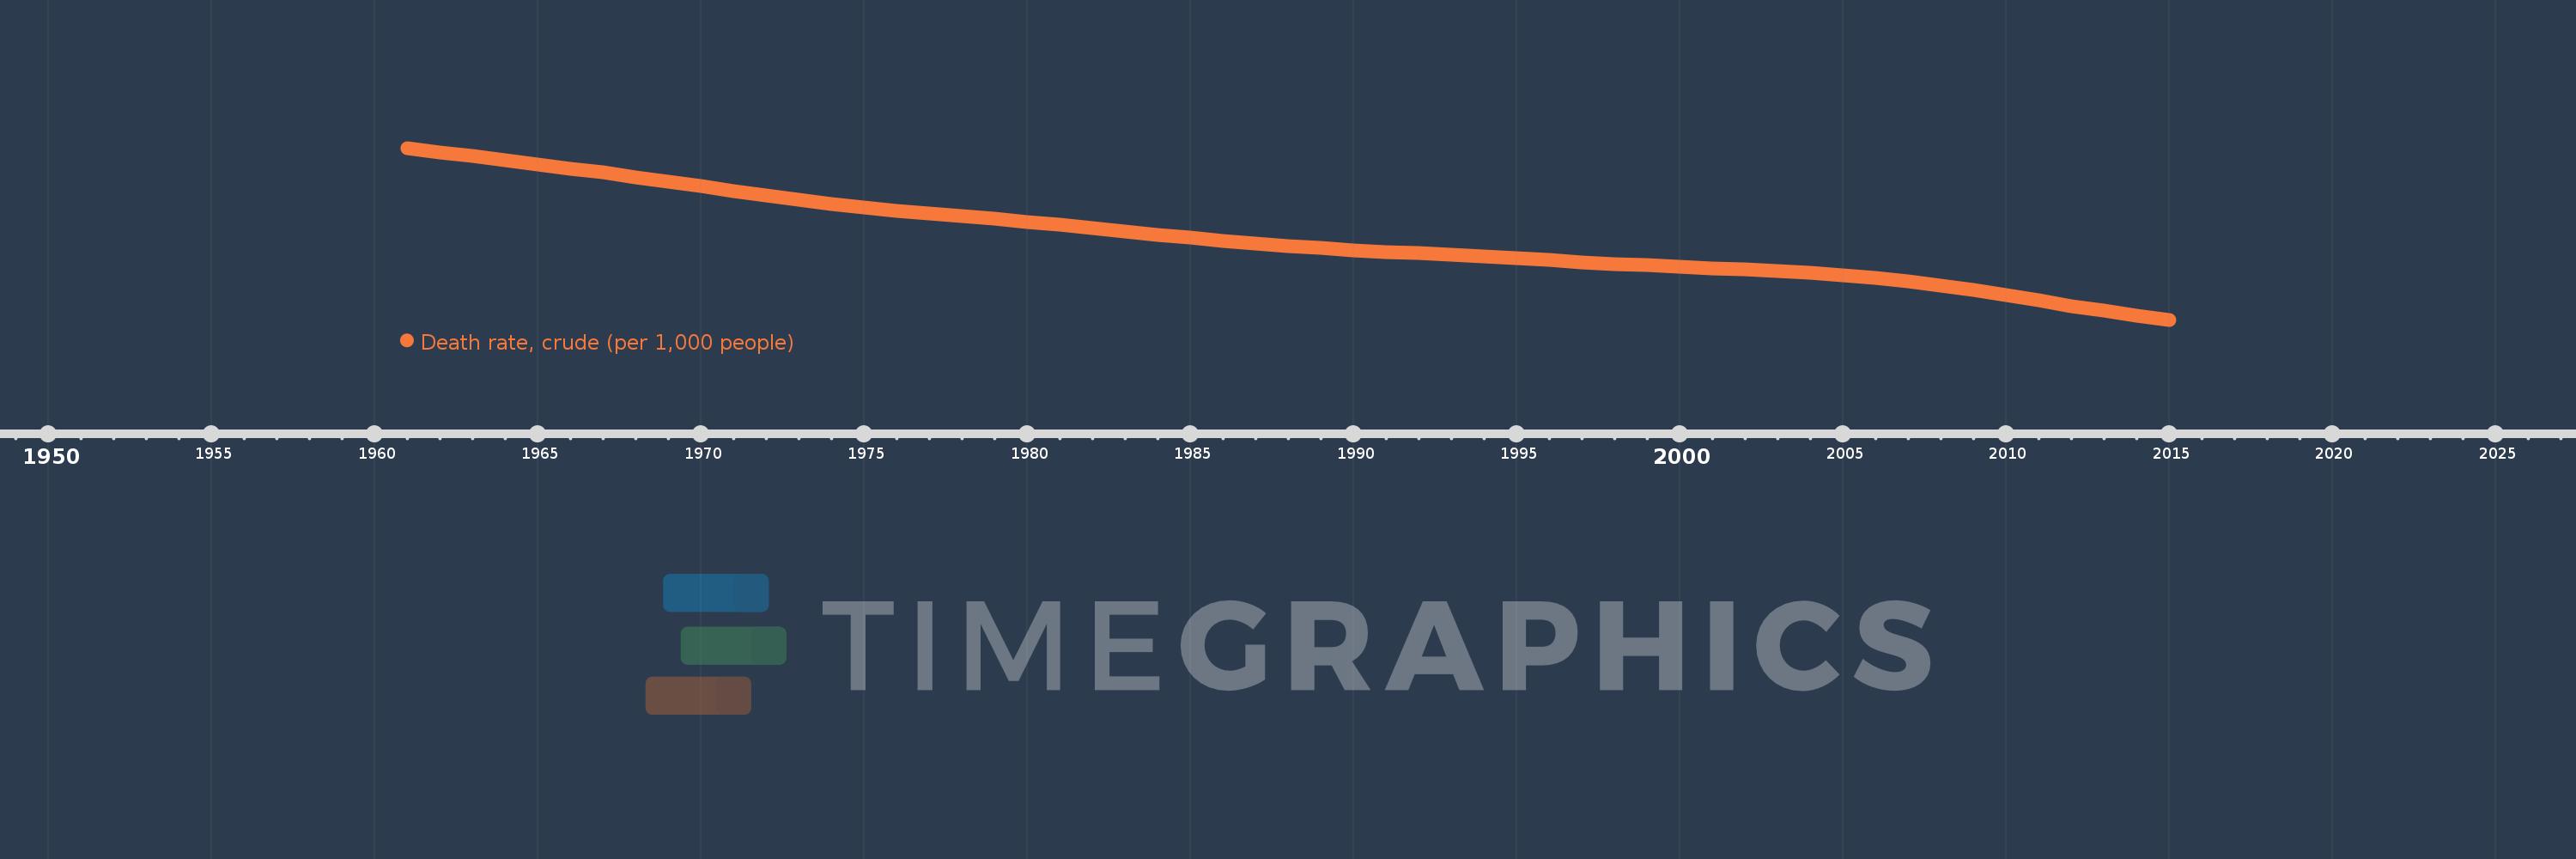
Death rate, crude (per 1,000 people)
2015,2014,2013,2012,2011,2010,2009,2008,2007,2006,2005,2004,2003,2002,2001,2000,1999,1998,1997,1996,1995,1994,1993,1992,1991,1990,1989,1988,1987,1986,1985,1984,1983,1982,1981,1980,1979,1978,1977,1976,1975,1974,1973,1972,1971,1970,1969,1968,1967,1966,1965,1964,1963,1962,1961
This statistics in other country:
AfghanistanAlbaniaAlgeriaAmerican SamoaAndorraAngolaAntigua and BarbudaArab WorldArgentinaArmeniaArubaAustraliaAustriaAzerbaijanBahamas, TheBahrainBangladeshBarbadosBelarusBelgiumBelizeBeninBermudaBhutanBoliviaBosnia and HerzegovinaBotswanaBrazilBrunei DarussalamBulgariaBurkina FasoBurundiCabo VerdeCambodiaCameroonCanadaCaribbean small statesCayman IslandsCentral African RepublicCentral Europe and the BalticsChadChannel IslandsChileChinaColombiaComorosCongo, Dem. Rep.Congo, Rep.Costa RicaCote d'IvoireCroatiaCubaCuracaoCyprusCzech RepublicDenmarkDjiboutiDominicaDominican RepublicEarly-demographic dividendEast Asia & PacificEast Asia & Pacific (excluding high income)East Asia & Pacific (IDA & IBRD countries)EcuadorEgypt, Arab Rep.El SalvadorEquatorial GuineaEritreaEstoniaEthiopiaEuro areaEurope & Central AsiaEurope & Central Asia (excluding high income)Europe & Central Asia (IDA & IBRD countries)European UnionFaroe IslandsFijiFinlandFragile and conflict affected situationsFranceFrench PolynesiaGabonGambia, TheGeorgiaGermanyGhanaGreeceGreenlandGrenadaGuamGuatemalaGuineaGuinea-BissauGuyanaHaitiHeavily indebted poor countries (HIPC)High incomeHondurasHong Kong SAR, ChinaHungaryIBRD onlyIcelandIDA & IBRD totalIDA blendIDA onlyIDA totalIndiaIndonesiaIran, Islamic Rep.IraqIrelandIsle of ManIsraelItalyJamaicaJapanJordanKazakhstanKenyaKiribatiKorea, Dem. People’s Rep.Korea, Rep.KosovoKuwaitKyrgyz RepublicLao PDRLate-demographic dividendLatin America & Caribbean Latin America & Caribbean (excluding high income)Latin America & the Caribbean (IDA & IBRD countries)LatviaLeast developed countries: UN classificationLebanonLesothoLiberiaLibyaLiechtensteinLithuaniaLow & middle incomeLow incomeLower middle incomeLuxembourgMacao SAR, ChinaMacedonia, FYRMadagascarMalawiMalaysiaMaldivesMaliMaltaMarshall IslandsMauritaniaMauritiusMexicoMicronesia, Fed. Sts.Middle East & North AfricaMiddle East & North Africa (excluding high income)Middle East & North Africa (IDA & IBRD countries)Middle incomeMoldovaMonacoMongoliaMontenegroMoroccoMozambiqueMyanmarNamibiaNepalNetherlandsNew CaledoniaNew ZealandNicaraguaNigerNigeriaNorth AmericaNorwayOECD membersOmanOther small statesPacific island small statesPakistanPalauPanamaPapua New GuineaParaguayPeruPhilippinesPolandPortugalPost-demographic dividendPre-demographic dividendPuerto RicoQatarRomaniaRussian FederationRwandaSamoaSan MarinoSao Tome and PrincipeSaudi ArabiaSenegalSerbiaSeychellesSierra LeoneSingaporeSint Maarten (Dutch part)Slovak RepublicSloveniaSmall statesSolomon IslandsSomaliaSouth AfricaSouth AsiaSouth Asia (IDA & IBRD)South SudanSpainSri LankaSt. Kitts and NevisSt. LuciaSt. Martin (French part)St. Vincent and the GrenadinesSub-Saharan Africa Sub-Saharan Africa (excluding high income)Sub-Saharan Africa (IDA & IBRD countries)SudanSurinameSwazilandSwedenSwitzerlandSyrian Arab RepublicTajikistanTanzaniaThailandTimor-LesteTogoTongaTrinidad and TobagoTunisiaTurkeyTurkmenistanUgandaUkraineUnited Arab EmiratesUnited KingdomUnited StatesUpper middle incomeUruguayUzbekistanVanuatuVenezuela, RBVietnamVirgin Islands (U.S.)West Bank and GazaWorldYemen, Rep.ZambiaZimbabwe Timeline:
This timeline shows a graph from 1961 to 2015 of Chad. No data until 1960. Number of actual observations by date: 55.
Source name:
World Development Indicators
Source organization:
(1) United Nations Population Division. World Population Prospects, (2) Census reports and other statistical publications from national statistical offices, (3) Eurostat: Demographic Statistics, (4) United Nations Statistical Division. Population and Vital Statistics Reprot (various years), (5) U.S. Census Bureau: International Database, and (6) Secretariat of the Pacific Community: Statistics and Demography Programme.
Categories, topics:
Health
Last updated:
apr 23, 2017
Indicators value changes by year
Minimum:
14.065
jan 1, 2015
Maximum:
26.546
jan 1, 1961
At the date of observation
Value
Absolute change
Change from previous value
jan 1, 1961
26.546
+26.546
0.0%
jan 1, 1962
26.24
-0.306
-1.15%
jan 1, 1963
25.937
-0.303
-1.15%
jan 1, 1964
25.639
-0.298
-1.15%
jan 1, 1965
25.346
-0.293
-1.14%
jan 1, 1966
25.052
-0.294
-1.16%
jan 1, 1967
24.749
-0.303
-1.21%
jan 1, 1968
24.432
-0.317
-1.28%
jan 1, 1969
24.098
-0.334
-1.37%
jan 1, 1970
23.754
-0.344
-1.43%
jan 1, 1971
23.407
-0.347
-1.46%
jan 1, 1972
23.072
-0.335
-1.43%
jan 1, 1973
22.759
-0.313
-1.36%
jan 1, 1974
22.475
-0.284
-1.25%
jan 1, 1975
22.222
-0.253
-1.13%
jan 1, 1976
21.995
-0.227
-1.02%
jan 1, 1977
21.788
-0.207
-0.94%
jan 1, 1978
21.587
-0.201
-0.92%
jan 1, 1979
21.384
-0.203
-0.94%
jan 1, 1980
21.175
-0.209
-0.98%
jan 1, 1981
20.955
-0.22
-1.04%
jan 1, 1982
20.724
-0.231
-1.1%
jan 1, 1983
20.489
-0.235
-1.13%
jan 1, 1984
20.254
-0.235
-1.15%
jan 1, 1985
20.023
-0.231
-1.14%
jan 1, 1986
19.804
-0.219
-1.09%
jan 1, 1987
19.603
-0.201
-1.01%
jan 1, 1988
19.423
-0.18
-0.92%
jan 1, 1989
19.266
-0.157
-0.81%
jan 1, 1990
19.129
-0.137
-0.71%
jan 1, 1991
19.007
-0.122
-0.64%
jan 1, 1992
18.892
-0.115
-0.61%
jan 1, 1993
18.777
-0.115
-0.61%
jan 1, 1994
18.655
-0.122
-0.65%
jan 1, 1995
18.524
-0.131
-0.7%
jan 1, 1996
18.389
-0.135
-0.73%
jan 1, 1997
18.256
-0.133
-0.72%
jan 1, 1998
18.131
-0.125
-0.68%
jan 1, 1999
18.019
-0.112
-0.62%
jan 1, 2000
17.915
-0.104
-0.58%
jan 1, 2001
17.815
-0.1
-0.56%
jan 1, 2002
17.712
-0.103
-0.58%
jan 1, 2003
17.598
-0.114
-0.64%
jan 1, 2004
17.462
-0.136
-0.77%
jan 1, 2005
17.297
-0.165
-0.94%
jan 1, 2006
17.094
-0.203
-1.17%
jan 1, 2007
16.843
-0.251
-1.47%
jan 1, 2008
16.545
-0.298
-1.77%
jan 1, 2009
16.207
-0.338
-2.04%
jan 1, 2010
15.839
-0.368
-2.27%
jan 1, 2011
15.454
-0.385
-2.43%
jan 1, 2012
15.071
-0.383
-2.48%
jan 1, 2013
14.705
-0.366
-2.43%
jan 1, 2014
14.367
-0.338
-2.3%
jan 1, 2015
14.065
-0.302
-2.1%
Ranking of countries by current statistics by years


Comments: