29
/
en
AIzaSyAYiBZKx7MnpbEhh9jyipgxe19OcubqV5w
April 1, 2024
54007
Pacific island small states
PSS
false
2
1
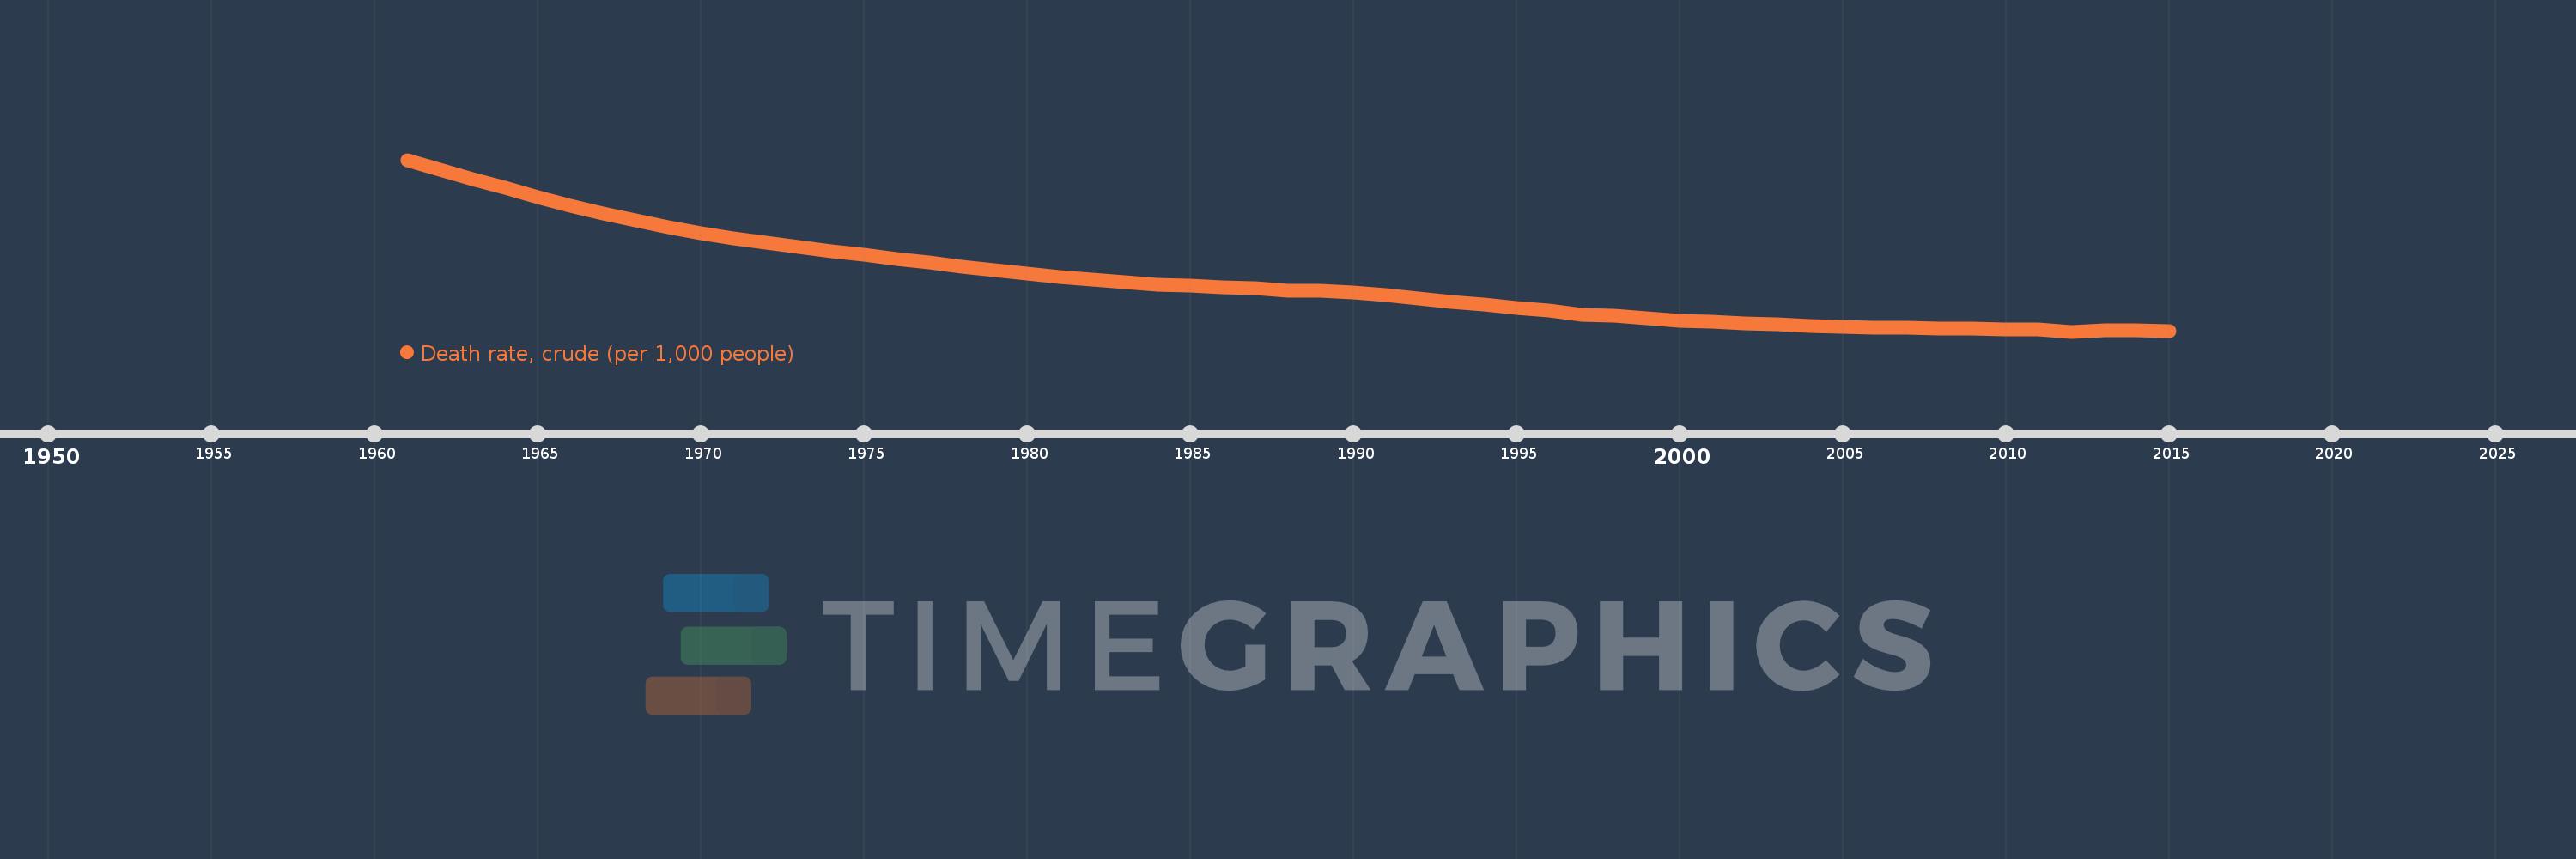
Death rate, crude (per 1,000 people)
2015,2014,2013,2012,2011,2010,2009,2008,2007,2006,2005,2004,2003,2002,2001,2000,1999,1998,1997,1996,1995,1994,1993,1992,1991,1990,1989,1988,1987,1986,1985,1984,1983,1982,1981,1980,1979,1978,1977,1976,1975,1974,1973,1972,1971,1970,1969,1968,1967,1966,1965,1964,1963,1962,1961
This statistics in other country:
AfghanistanAlbaniaAlgeriaAmerican SamoaAndorraAngolaAntigua and BarbudaArab WorldArgentinaArmeniaArubaAustraliaAustriaAzerbaijanBahamas, TheBahrainBangladeshBarbadosBelarusBelgiumBelizeBeninBermudaBhutanBoliviaBosnia and HerzegovinaBotswanaBrazilBrunei DarussalamBulgariaBurkina FasoBurundiCabo VerdeCambodiaCameroonCanadaCaribbean small statesCayman IslandsCentral African RepublicCentral Europe and the BalticsChadChannel IslandsChileChinaColombiaComorosCongo, Dem. Rep.Congo, Rep.Costa RicaCote d'IvoireCroatiaCubaCuracaoCyprusCzech RepublicDenmarkDjiboutiDominicaDominican RepublicEarly-demographic dividendEast Asia & PacificEast Asia & Pacific (excluding high income)East Asia & Pacific (IDA & IBRD countries)EcuadorEgypt, Arab Rep.El SalvadorEquatorial GuineaEritreaEstoniaEthiopiaEuro areaEurope & Central AsiaEurope & Central Asia (excluding high income)Europe & Central Asia (IDA & IBRD countries)European UnionFaroe IslandsFijiFinlandFragile and conflict affected situationsFranceFrench PolynesiaGabonGambia, TheGeorgiaGermanyGhanaGreeceGreenlandGrenadaGuamGuatemalaGuineaGuinea-BissauGuyanaHaitiHeavily indebted poor countries (HIPC)High incomeHondurasHong Kong SAR, ChinaHungaryIBRD onlyIcelandIDA & IBRD totalIDA blendIDA onlyIDA totalIndiaIndonesiaIran, Islamic Rep.IraqIrelandIsle of ManIsraelItalyJamaicaJapanJordanKazakhstanKenyaKiribatiKorea, Dem. People’s Rep.Korea, Rep.KosovoKuwaitKyrgyz RepublicLao PDRLate-demographic dividendLatin America & Caribbean Latin America & Caribbean (excluding high income)Latin America & the Caribbean (IDA & IBRD countries)LatviaLeast developed countries: UN classificationLebanonLesothoLiberiaLibyaLiechtensteinLithuaniaLow & middle incomeLow incomeLower middle incomeLuxembourgMacao SAR, ChinaMacedonia, FYRMadagascarMalawiMalaysiaMaldivesMaliMaltaMarshall IslandsMauritaniaMauritiusMexicoMicronesia, Fed. Sts.Middle East & North AfricaMiddle East & North Africa (excluding high income)Middle East & North Africa (IDA & IBRD countries)Middle incomeMoldovaMonacoMongoliaMontenegroMoroccoMozambiqueMyanmarNamibiaNepalNetherlandsNew CaledoniaNew ZealandNicaraguaNigerNigeriaNorth AmericaNorwayOECD membersOmanOther small statesPacific island small statesPakistanPalauPanamaPapua New GuineaParaguayPeruPhilippinesPolandPortugalPost-demographic dividendPre-demographic dividendPuerto RicoQatarRomaniaRussian FederationRwandaSamoaSan MarinoSao Tome and PrincipeSaudi ArabiaSenegalSerbiaSeychellesSierra LeoneSingaporeSint Maarten (Dutch part)Slovak RepublicSloveniaSmall statesSolomon IslandsSomaliaSouth AfricaSouth AsiaSouth Asia (IDA & IBRD)South SudanSpainSri LankaSt. Kitts and NevisSt. LuciaSt. Martin (French part)St. Vincent and the GrenadinesSub-Saharan Africa Sub-Saharan Africa (excluding high income)Sub-Saharan Africa (IDA & IBRD countries)SudanSurinameSwazilandSwedenSwitzerlandSyrian Arab RepublicTajikistanTanzaniaThailandTimor-LesteTogoTongaTrinidad and TobagoTunisiaTurkeyTurkmenistanUgandaUkraineUnited Arab EmiratesUnited KingdomUnited StatesUpper middle incomeUruguayUzbekistanVanuatuVenezuela, RBVietnamVirgin Islands (U.S.)West Bank and GazaWorldYemen, Rep.ZambiaZimbabwe Timeline:
This timeline shows a graph from 1961 to 2015 of Pacific island small states. No data until 1960. Number of actual observations by date: 55.
Source name:
World Development Indicators
Source organization:
(1) United Nations Population Division. World Population Prospects, (2) Census reports and other statistical publications from national statistical offices, (3) Eurostat: Demographic Statistics, (4) United Nations Statistical Division. Population and Vital Statistics Reprot (various years), (5) U.S. Census Bureau: International Database, and (6) Secretariat of the Pacific Community: Statistics and Demography Programme.
Categories, topics:
Health
Last updated:
apr 23, 2017
Indicators value changes by year
Maximum:
13.151
jan 1, 1961
At the date of observation
Value
Absolute change
Change from previous value
jan 1, 1961
13.151
+13.151
0.0%
jan 1, 1962
12.761
-0.389
-2.96%
jan 1, 1963
12.376
-0.386
-3.02%
jan 1, 1964
11.999
-0.377
-3.05%
jan 1, 1965
11.635
-0.363
-3.03%
jan 1, 1966
11.291
-0.344
-2.96%
jan 1, 1967
10.971
-0.32
-2.83%
jan 1, 1968
10.677
-0.294
-2.68%
jan 1, 1969
10.409
-0.268
-2.51%
jan 1, 1970
10.169
-0.241
-2.31%
jan 1, 1971
9.953
-0.216
-2.12%
jan 1, 1972
9.76
-0.193
-1.94%
jan 1, 1973
9.584
-0.176
-1.81%
jan 1, 1974
9.419
-0.165
-1.72%
jan 1, 1975
9.261
-0.158
-1.68%
jan 1, 1976
9.105
-0.156
-1.68%
jan 1, 1977
8.95
-0.155
-1.7%
jan 1, 1978
8.797
-0.153
-1.71%
jan 1, 1979
8.646
-0.15
-1.71%
jan 1, 1980
8.501
-0.146
-1.69%
jan 1, 1981
8.365
-0.136
-1.6%
jan 1, 1982
8.244
-0.121
-1.44%
jan 1, 1983
8.143
-0.101
-1.23%
jan 1, 1984
8.062
-0.081
-0.99%
jan 1, 1985
8.001
-0.061
-0.76%
jan 1, 1986
7.954
-0.047
-0.59%
jan 1, 1987
7.911
-0.043
-0.54%
jan 1, 1988
7.788
-0.123
-1.56%
jan 1, 1989
7.801
+0.014
0.18%
jan 1, 1990
7.72
-0.082
-1.05%
jan 1, 1991
7.617
-0.102
-1.33%
jan 1, 1992
7.485
-0.132
-1.74%
jan 1, 1993
7.362
-0.123
-1.65%
jan 1, 1994
7.229
-0.133
-1.81%
jan 1, 1995
7.108
-0.121
-1.67%
jan 1, 1996
6.978
-0.13
-1.83%
jan 1, 1997
6.809
-0.169
-2.42%
jan 1, 1998
6.777
-0.032
-0.47%
jan 1, 1999
6.689
-0.088
-1.3%
jan 1, 2000
6.563
-0.126
-1.88%
jan 1, 2001
6.534
-0.029
-0.44%
jan 1, 2002
6.478
-0.056
-0.86%
jan 1, 2003
6.423
-0.055
-0.85%
jan 1, 2004
6.378
-0.045
-0.7%
jan 1, 2005
6.342
-0.036
-0.56%
jan 1, 2006
6.308
-0.034
-0.54%
jan 1, 2007
6.285
-0.023
-0.37%
jan 1, 2008
6.264
-0.021
-0.34%
jan 1, 2009
6.25
-0.014
-0.22%
jan 1, 2010
6.231
-0.019
-0.31%
jan 1, 2011
6.208
-0.023
-0.36%
jan 1, 2012
6.135
-0.073
-1.18%
jan 1, 2013
6.178
+0.042
0.69%
jan 1, 2014
6.201
+0.023
0.38%
jan 1, 2015
6.154
-0.047
-0.76%
Ranking of countries by current statistics by years


Comments: