29
/
en
AIzaSyAYiBZKx7MnpbEhh9jyipgxe19OcubqV5w
April 1, 2024
192897
Mauritania
MRT
true
2
1
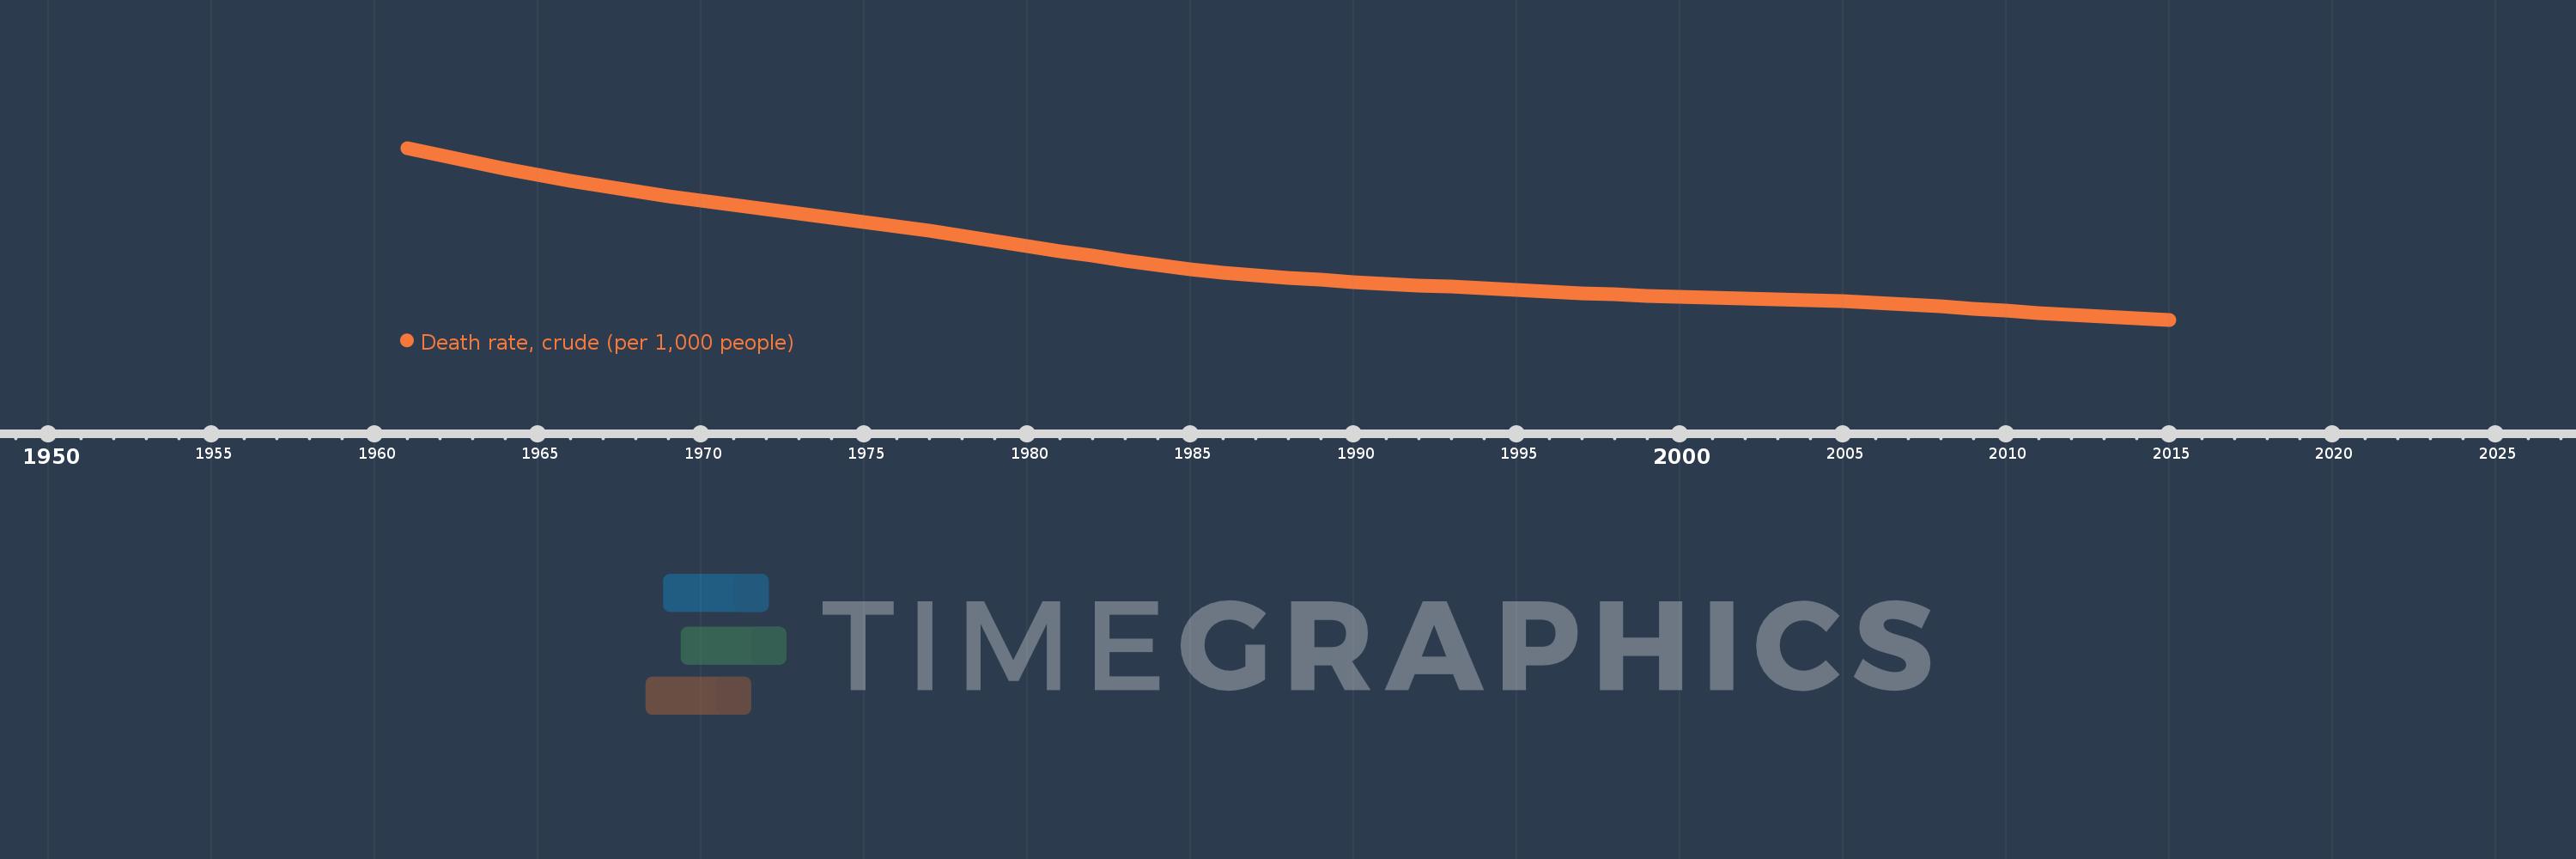
Death rate, crude (per 1,000 people)
2015,2014,2013,2012,2011,2010,2009,2008,2007,2006,2005,2004,2003,2002,2001,2000,1999,1998,1997,1996,1995,1994,1993,1992,1991,1990,1989,1988,1987,1986,1985,1984,1983,1982,1981,1980,1979,1978,1977,1976,1975,1974,1973,1972,1971,1970,1969,1968,1967,1966,1965,1964,1963,1962,1961
This statistics in other country:
AfghanistanAlbaniaAlgeriaAmerican SamoaAndorraAngolaAntigua and BarbudaArab WorldArgentinaArmeniaArubaAustraliaAustriaAzerbaijanBahamas, TheBahrainBangladeshBarbadosBelarusBelgiumBelizeBeninBermudaBhutanBoliviaBosnia and HerzegovinaBotswanaBrazilBrunei DarussalamBulgariaBurkina FasoBurundiCabo VerdeCambodiaCameroonCanadaCaribbean small statesCayman IslandsCentral African RepublicCentral Europe and the BalticsChadChannel IslandsChileChinaColombiaComorosCongo, Dem. Rep.Congo, Rep.Costa RicaCote d'IvoireCroatiaCubaCuracaoCyprusCzech RepublicDenmarkDjiboutiDominicaDominican RepublicEarly-demographic dividendEast Asia & PacificEast Asia & Pacific (excluding high income)East Asia & Pacific (IDA & IBRD countries)EcuadorEgypt, Arab Rep.El SalvadorEquatorial GuineaEritreaEstoniaEthiopiaEuro areaEurope & Central AsiaEurope & Central Asia (excluding high income)Europe & Central Asia (IDA & IBRD countries)European UnionFaroe IslandsFijiFinlandFragile and conflict affected situationsFranceFrench PolynesiaGabonGambia, TheGeorgiaGermanyGhanaGreeceGreenlandGrenadaGuamGuatemalaGuineaGuinea-BissauGuyanaHaitiHeavily indebted poor countries (HIPC)High incomeHondurasHong Kong SAR, ChinaHungaryIBRD onlyIcelandIDA & IBRD totalIDA blendIDA onlyIDA totalIndiaIndonesiaIran, Islamic Rep.IraqIrelandIsle of ManIsraelItalyJamaicaJapanJordanKazakhstanKenyaKiribatiKorea, Dem. People’s Rep.Korea, Rep.KosovoKuwaitKyrgyz RepublicLao PDRLate-demographic dividendLatin America & Caribbean Latin America & Caribbean (excluding high income)Latin America & the Caribbean (IDA & IBRD countries)LatviaLeast developed countries: UN classificationLebanonLesothoLiberiaLibyaLiechtensteinLithuaniaLow & middle incomeLow incomeLower middle incomeLuxembourgMacao SAR, ChinaMacedonia, FYRMadagascarMalawiMalaysiaMaldivesMaliMaltaMarshall IslandsMauritaniaMauritiusMexicoMicronesia, Fed. Sts.Middle East & North AfricaMiddle East & North Africa (excluding high income)Middle East & North Africa (IDA & IBRD countries)Middle incomeMoldovaMonacoMongoliaMontenegroMoroccoMozambiqueMyanmarNamibiaNepalNetherlandsNew CaledoniaNew ZealandNicaraguaNigerNigeriaNorth AmericaNorwayOECD membersOmanOther small statesPacific island small statesPakistanPalauPanamaPapua New GuineaParaguayPeruPhilippinesPolandPortugalPost-demographic dividendPre-demographic dividendPuerto RicoQatarRomaniaRussian FederationRwandaSamoaSan MarinoSao Tome and PrincipeSaudi ArabiaSenegalSerbiaSeychellesSierra LeoneSingaporeSint Maarten (Dutch part)Slovak RepublicSloveniaSmall statesSolomon IslandsSomaliaSouth AfricaSouth AsiaSouth Asia (IDA & IBRD)South SudanSpainSri LankaSt. Kitts and NevisSt. LuciaSt. Martin (French part)St. Vincent and the GrenadinesSub-Saharan Africa Sub-Saharan Africa (excluding high income)Sub-Saharan Africa (IDA & IBRD countries)SudanSurinameSwazilandSwedenSwitzerlandSyrian Arab RepublicTajikistanTanzaniaThailandTimor-LesteTogoTongaTrinidad and TobagoTunisiaTurkeyTurkmenistanUgandaUkraineUnited Arab EmiratesUnited KingdomUnited StatesUpper middle incomeUruguayUzbekistanVanuatuVenezuela, RBVietnamVirgin Islands (U.S.)West Bank and GazaWorldYemen, Rep.ZambiaZimbabwe Timeline:
This timeline shows a graph from 1961 to 2015 of Mauritania. No data until 1960. Number of actual observations by date: 55.
Source name:
World Development Indicators
Source organization:
(1) United Nations Population Division. World Population Prospects, (2) Census reports and other statistical publications from national statistical offices, (3) Eurostat: Demographic Statistics, (4) United Nations Statistical Division. Population and Vital Statistics Reprot (various years), (5) U.S. Census Bureau: International Database, and (6) Secretariat of the Pacific Community: Statistics and Demography Programme.
Categories, topics:
Health
Last updated:
apr 23, 2017
Indicators value changes by year
Maximum:
20.343
jan 1, 1961
At the date of observation
Value
Absolute change
Change from previous value
jan 1, 1961
20.343
+20.343
0.0%
jan 1, 1962
19.827
-0.516
-2.54%
jan 1, 1963
19.324
-0.503
-2.54%
jan 1, 1964
18.843
-0.481
-2.49%
jan 1, 1965
18.389
-0.454
-2.41%
jan 1, 1966
17.967
-0.422
-2.29%
jan 1, 1967
17.576
-0.391
-2.18%
jan 1, 1968
17.211
-0.365
-2.08%
jan 1, 1969
16.865
-0.346
-2.01%
jan 1, 1970
16.533
-0.332
-1.97%
jan 1, 1971
16.214
-0.319
-1.93%
jan 1, 1972
15.904
-0.31
-1.91%
jan 1, 1973
15.601
-0.303
-1.91%
jan 1, 1974
15.3
-0.301
-1.93%
jan 1, 1975
14.999
-0.301
-1.97%
jan 1, 1976
14.688
-0.311
-2.07%
jan 1, 1977
14.36
-0.328
-2.23%
jan 1, 1978
14.016
-0.344
-2.4%
jan 1, 1979
13.657
-0.359
-2.56%
jan 1, 1980
13.288
-0.369
-2.7%
jan 1, 1981
12.917
-0.371
-2.79%
jan 1, 1982
12.554
-0.363
-2.81%
jan 1, 1983
12.211
-0.343
-2.73%
jan 1, 1984
11.895
-0.316
-2.59%
jan 1, 1985
11.612
-0.283
-2.38%
jan 1, 1986
11.365
-0.247
-2.13%
jan 1, 1987
11.155
-0.21
-1.85%
jan 1, 1988
10.975
-0.18
-1.61%
jan 1, 1989
10.818
-0.157
-1.43%
jan 1, 1990
10.68
-0.138
-1.28%
jan 1, 1991
10.553
-0.127
-1.19%
jan 1, 1992
10.434
-0.119
-1.13%
jan 1, 1993
10.317
-0.117
-1.12%
jan 1, 1994
10.2
-0.117
-1.13%
jan 1, 1995
10.083
-0.117
-1.15%
jan 1, 1996
9.968
-0.115
-1.14%
jan 1, 1997
9.861
-0.107
-1.07%
jan 1, 1998
9.767
-0.094
-0.95%
jan 1, 1999
9.687
-0.08
-0.82%
jan 1, 2000
9.62
-0.067
-0.69%
jan 1, 2001
9.561
-0.059
-0.61%
jan 1, 2002
9.504
-0.057
-0.6%
jan 1, 2003
9.442
-0.062
-0.65%
jan 1, 2004
9.369
-0.073
-0.77%
jan 1, 2005
9.281
-0.088
-0.94%
jan 1, 2006
9.176
-0.105
-1.13%
jan 1, 2007
9.052
-0.124
-1.35%
jan 1, 2008
8.913
-0.139
-1.54%
jan 1, 2009
8.764
-0.149
-1.67%
jan 1, 2010
8.608
-0.156
-1.78%
jan 1, 2011
8.454
-0.154
-1.79%
jan 1, 2012
8.306
-0.148
-1.75%
jan 1, 2013
8.17
-0.136
-1.64%
jan 1, 2014
8.05
-0.12
-1.47%
jan 1, 2015
7.947
-0.103
-1.28%
Ranking of countries by current statistics by years


Comments: