29
/
en
AIzaSyAYiBZKx7MnpbEhh9jyipgxe19OcubqV5w
April 1, 2024
140205
Ghana
GHA
true
2
1
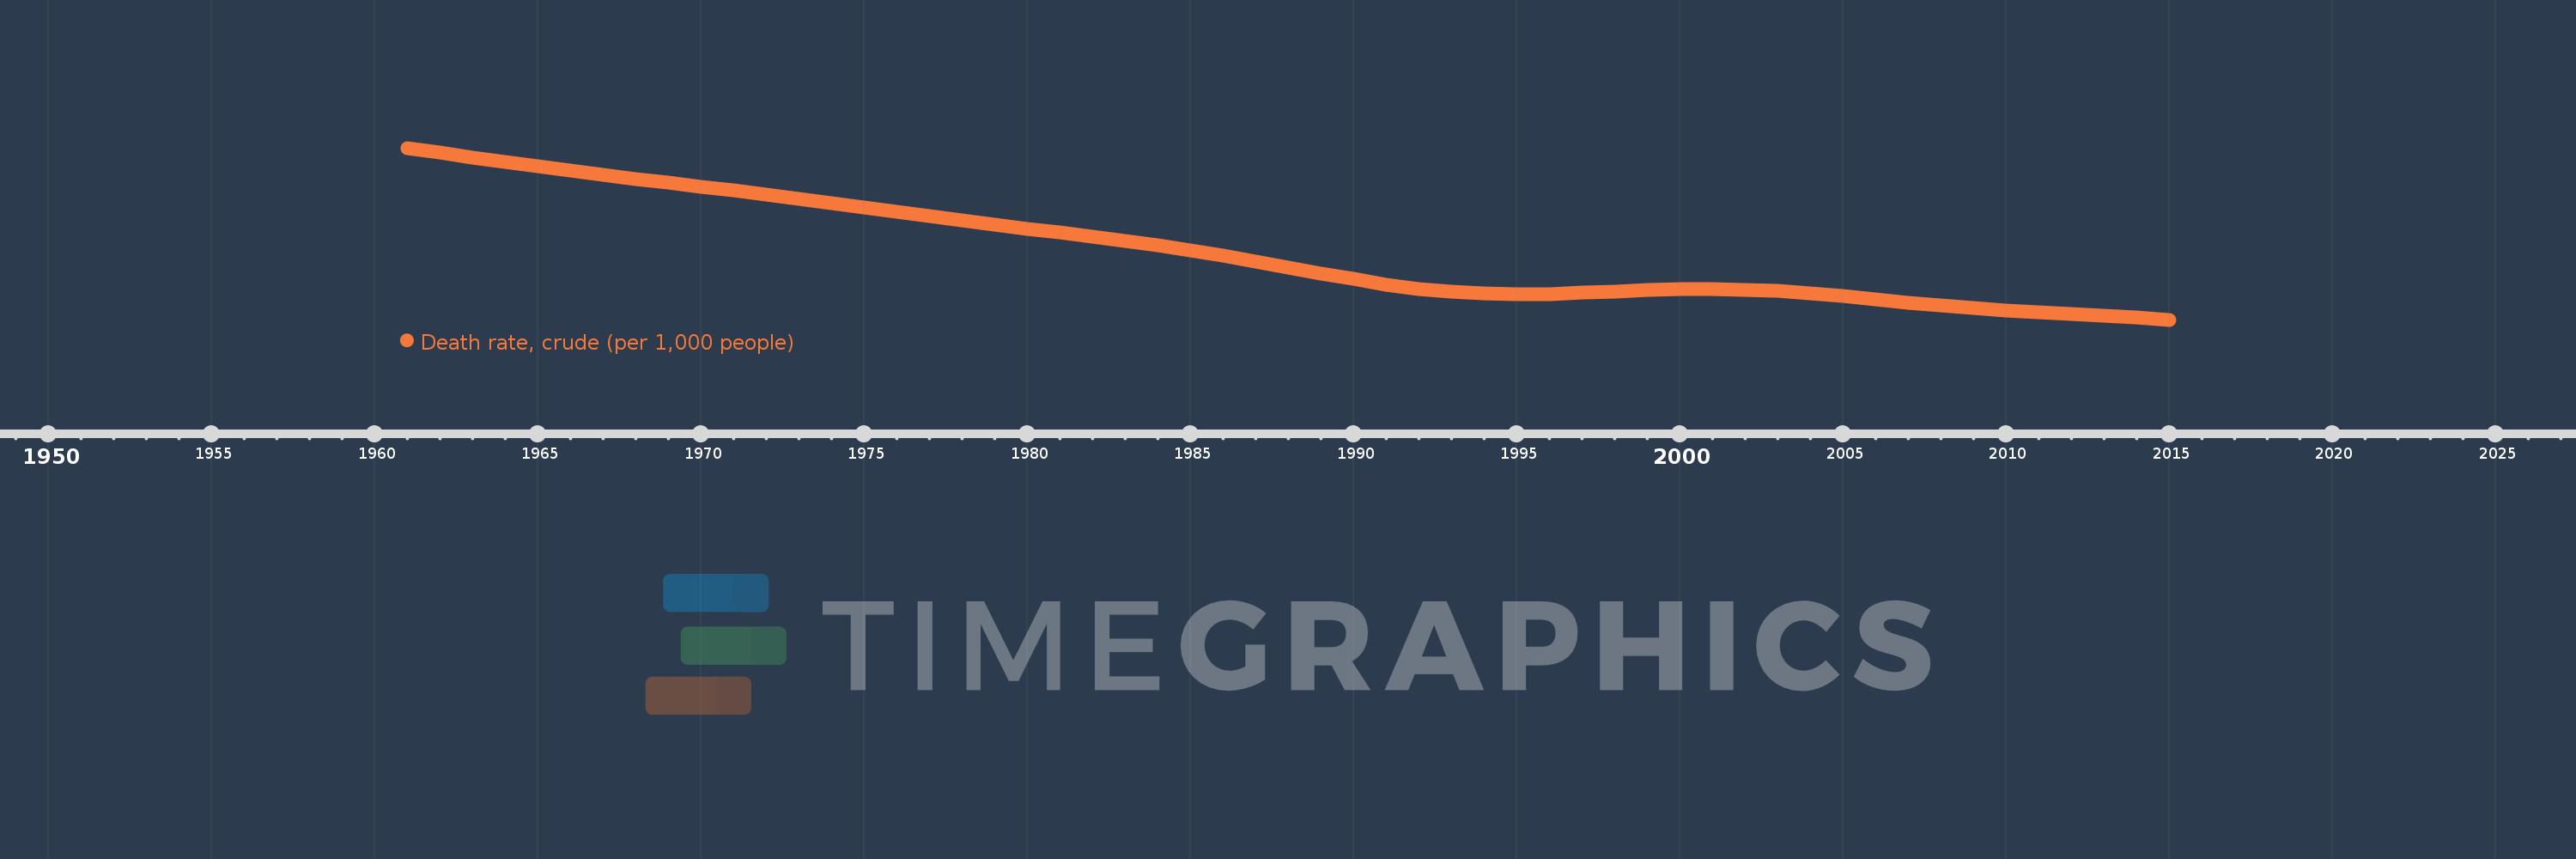
Death rate, crude (per 1,000 people)
2015,2014,2013,2012,2011,2010,2009,2008,2007,2006,2005,2004,2003,2002,2001,2000,1999,1998,1997,1996,1995,1994,1993,1992,1991,1990,1989,1988,1987,1986,1985,1984,1983,1982,1981,1980,1979,1978,1977,1976,1975,1974,1973,1972,1971,1970,1969,1968,1967,1966,1965,1964,1963,1962,1961
This statistics in other country:
AfghanistanAlbaniaAlgeriaAmerican SamoaAndorraAngolaAntigua and BarbudaArab WorldArgentinaArmeniaArubaAustraliaAustriaAzerbaijanBahamas, TheBahrainBangladeshBarbadosBelarusBelgiumBelizeBeninBermudaBhutanBoliviaBosnia and HerzegovinaBotswanaBrazilBrunei DarussalamBulgariaBurkina FasoBurundiCabo VerdeCambodiaCameroonCanadaCaribbean small statesCayman IslandsCentral African RepublicCentral Europe and the BalticsChadChannel IslandsChileChinaColombiaComorosCongo, Dem. Rep.Congo, Rep.Costa RicaCote d'IvoireCroatiaCubaCuracaoCyprusCzech RepublicDenmarkDjiboutiDominicaDominican RepublicEarly-demographic dividendEast Asia & PacificEast Asia & Pacific (excluding high income)East Asia & Pacific (IDA & IBRD countries)EcuadorEgypt, Arab Rep.El SalvadorEquatorial GuineaEritreaEstoniaEthiopiaEuro areaEurope & Central AsiaEurope & Central Asia (excluding high income)Europe & Central Asia (IDA & IBRD countries)European UnionFaroe IslandsFijiFinlandFragile and conflict affected situationsFranceFrench PolynesiaGabonGambia, TheGeorgiaGermanyGhanaGreeceGreenlandGrenadaGuamGuatemalaGuineaGuinea-BissauGuyanaHaitiHeavily indebted poor countries (HIPC)High incomeHondurasHong Kong SAR, ChinaHungaryIBRD onlyIcelandIDA & IBRD totalIDA blendIDA onlyIDA totalIndiaIndonesiaIran, Islamic Rep.IraqIrelandIsle of ManIsraelItalyJamaicaJapanJordanKazakhstanKenyaKiribatiKorea, Dem. People’s Rep.Korea, Rep.KosovoKuwaitKyrgyz RepublicLao PDRLate-demographic dividendLatin America & Caribbean Latin America & Caribbean (excluding high income)Latin America & the Caribbean (IDA & IBRD countries)LatviaLeast developed countries: UN classificationLebanonLesothoLiberiaLibyaLiechtensteinLithuaniaLow & middle incomeLow incomeLower middle incomeLuxembourgMacao SAR, ChinaMacedonia, FYRMadagascarMalawiMalaysiaMaldivesMaliMaltaMarshall IslandsMauritaniaMauritiusMexicoMicronesia, Fed. Sts.Middle East & North AfricaMiddle East & North Africa (excluding high income)Middle East & North Africa (IDA & IBRD countries)Middle incomeMoldovaMonacoMongoliaMontenegroMoroccoMozambiqueMyanmarNamibiaNepalNetherlandsNew CaledoniaNew ZealandNicaraguaNigerNigeriaNorth AmericaNorwayOECD membersOmanOther small statesPacific island small statesPakistanPalauPanamaPapua New GuineaParaguayPeruPhilippinesPolandPortugalPost-demographic dividendPre-demographic dividendPuerto RicoQatarRomaniaRussian FederationRwandaSamoaSan MarinoSao Tome and PrincipeSaudi ArabiaSenegalSerbiaSeychellesSierra LeoneSingaporeSint Maarten (Dutch part)Slovak RepublicSloveniaSmall statesSolomon IslandsSomaliaSouth AfricaSouth AsiaSouth Asia (IDA & IBRD)South SudanSpainSri LankaSt. Kitts and NevisSt. LuciaSt. Martin (French part)St. Vincent and the GrenadinesSub-Saharan Africa Sub-Saharan Africa (excluding high income)Sub-Saharan Africa (IDA & IBRD countries)SudanSurinameSwazilandSwedenSwitzerlandSyrian Arab RepublicTajikistanTanzaniaThailandTimor-LesteTogoTongaTrinidad and TobagoTunisiaTurkeyTurkmenistanUgandaUkraineUnited Arab EmiratesUnited KingdomUnited StatesUpper middle incomeUruguayUzbekistanVanuatuVenezuela, RBVietnamVirgin Islands (U.S.)West Bank and GazaWorldYemen, Rep.ZambiaZimbabwe Timeline:
This timeline shows a graph from 1961 to 2015 of Ghana. No data until 1960. Number of actual observations by date: 55.
Source name:
World Development Indicators
Source organization:
(1) United Nations Population Division. World Population Prospects, (2) Census reports and other statistical publications from national statistical offices, (3) Eurostat: Demographic Statistics, (4) United Nations Statistical Division. Population and Vital Statistics Reprot (various years), (5) U.S. Census Bureau: International Database, and (6) Secretariat of the Pacific Community: Statistics and Demography Programme.
Categories, topics:
Health
Last updated:
apr 23, 2017
Indicators value changes by year
Maximum:
18.435
jan 1, 1961
At the date of observation
Value
Absolute change
Change from previous value
jan 1, 1961
18.435
+18.435
0.0%
jan 1, 1962
18.16
-0.275
-1.49%
jan 1, 1963
17.9
-0.26
-1.43%
jan 1, 1964
17.652
-0.248
-1.39%
jan 1, 1965
17.414
-0.238
-1.35%
jan 1, 1966
17.182
-0.232
-1.33%
jan 1, 1967
16.955
-0.227
-1.32%
jan 1, 1968
16.734
-0.221
-1.3%
jan 1, 1969
16.515
-0.219
-1.31%
jan 1, 1970
16.296
-0.219
-1.33%
jan 1, 1971
16.074
-0.222
-1.36%
jan 1, 1972
15.847
-0.227
-1.41%
jan 1, 1973
15.614
-0.233
-1.47%
jan 1, 1974
15.376
-0.238
-1.52%
jan 1, 1975
15.133
-0.243
-1.58%
jan 1, 1976
14.889
-0.244
-1.61%
jan 1, 1977
14.65
-0.239
-1.61%
jan 1, 1978
14.417
-0.233
-1.59%
jan 1, 1979
14.193
-0.224
-1.55%
jan 1, 1980
13.975
-0.218
-1.54%
jan 1, 1981
13.757
-0.218
-1.56%
jan 1, 1982
13.534
-0.223
-1.62%
jan 1, 1983
13.298
-0.236
-1.74%
jan 1, 1984
13.046
-0.252
-1.9%
jan 1, 1985
12.776
-0.27
-2.07%
jan 1, 1986
12.486
-0.29
-2.27%
jan 1, 1987
12.174
-0.312
-2.5%
jan 1, 1988
11.845
-0.329
-2.7%
jan 1, 1989
11.513
-0.332
-2.8%
jan 1, 1990
11.19
-0.323
-2.81%
jan 1, 1991
10.898
-0.292
-2.61%
jan 1, 1992
10.66
-0.238
-2.18%
jan 1, 1993
10.488
-0.172
-1.61%
jan 1, 1994
10.385
-0.103
-0.98%
jan 1, 1995
10.35
-0.035
-0.34%
jan 1, 1996
10.372
+0.022
0.21%
jan 1, 1997
10.436
+0.064
0.62%
jan 1, 1998
10.517
+0.081
0.78%
jan 1, 1999
10.59
+0.073
0.69%
jan 1, 2000
10.641
+0.051
0.48%
jan 1, 2001
10.652
+0.011
0.1%
jan 1, 2002
10.612
-0.04
-0.38%
jan 1, 2003
10.528
-0.084
-0.79%
jan 1, 2004
10.405
-0.123
-1.17%
jan 1, 2005
10.251
-0.154
-1.48%
jan 1, 2006
10.076
-0.175
-1.71%
jan 1, 2007
9.897
-0.179
-1.78%
jan 1, 2008
9.729
-0.168
-1.7%
jan 1, 2009
9.581
-0.148
-1.52%
jan 1, 2010
9.456
-0.125
-1.3%
jan 1, 2011
9.353
-0.103
-1.09%
jan 1, 2012
9.261
-0.092
-0.98%
jan 1, 2013
9.168
-0.093
-1.0%
jan 1, 2014
9.064
-0.104
-1.13%
jan 1, 2015
8.948
-0.116
-1.28%
Ranking of countries by current statistics by years


Comments: