29
/
en
AIzaSyAYiBZKx7MnpbEhh9jyipgxe19OcubqV5w
April 1, 2024
137833
Georgia
GEO
true
2
1
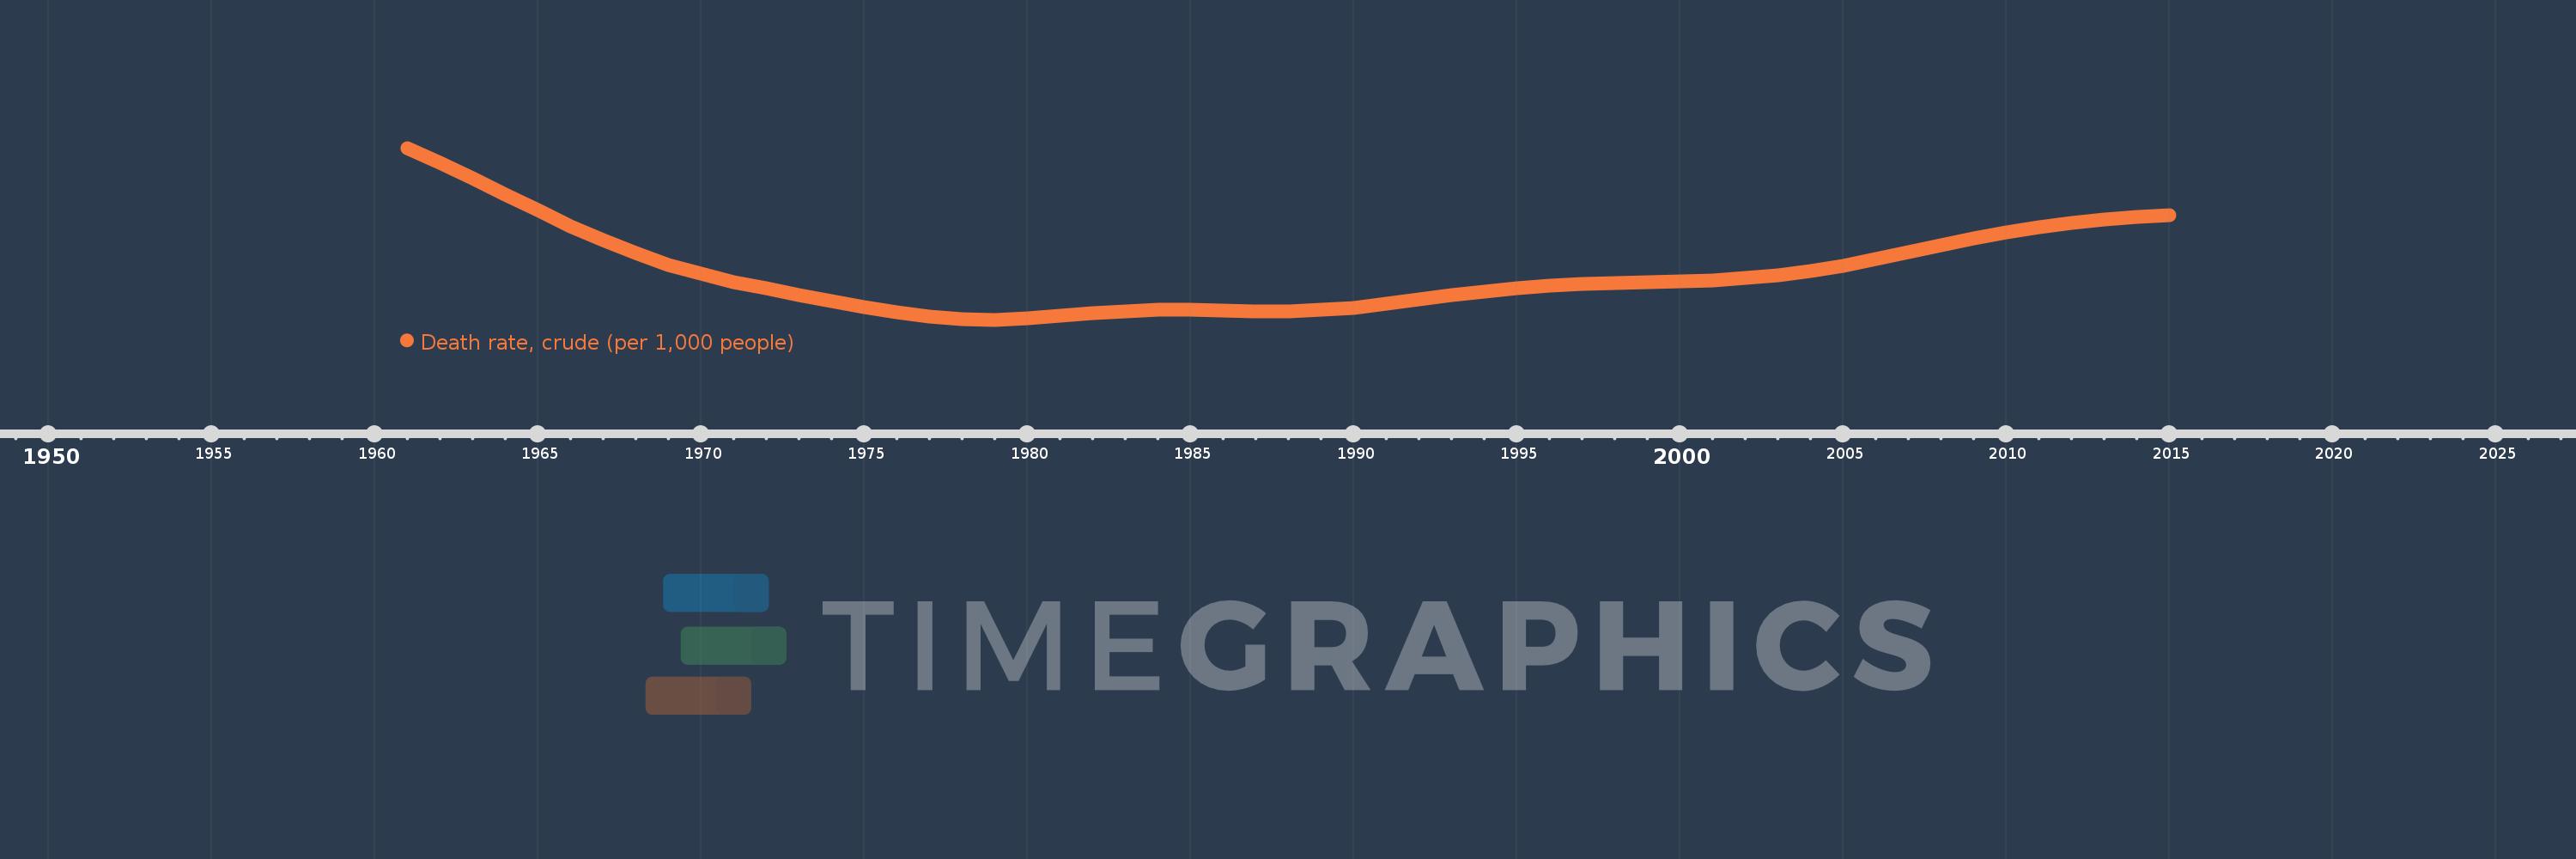
Death rate, crude (per 1,000 people)
2015,2014,2013,2012,2011,2010,2009,2008,2007,2006,2005,2004,2003,2002,2001,2000,1999,1998,1997,1996,1995,1994,1993,1992,1991,1990,1989,1988,1987,1986,1985,1984,1983,1982,1981,1980,1979,1978,1977,1976,1975,1974,1973,1972,1971,1970,1969,1968,1967,1966,1965,1964,1963,1962,1961
This statistics in other country:
AfghanistanAlbaniaAlgeriaAmerican SamoaAndorraAngolaAntigua and BarbudaArab WorldArgentinaArmeniaArubaAustraliaAustriaAzerbaijanBahamas, TheBahrainBangladeshBarbadosBelarusBelgiumBelizeBeninBermudaBhutanBoliviaBosnia and HerzegovinaBotswanaBrazilBrunei DarussalamBulgariaBurkina FasoBurundiCabo VerdeCambodiaCameroonCanadaCaribbean small statesCayman IslandsCentral African RepublicCentral Europe and the BalticsChadChannel IslandsChileChinaColombiaComorosCongo, Dem. Rep.Congo, Rep.Costa RicaCote d'IvoireCroatiaCubaCuracaoCyprusCzech RepublicDenmarkDjiboutiDominicaDominican RepublicEarly-demographic dividendEast Asia & PacificEast Asia & Pacific (excluding high income)East Asia & Pacific (IDA & IBRD countries)EcuadorEgypt, Arab Rep.El SalvadorEquatorial GuineaEritreaEstoniaEthiopiaEuro areaEurope & Central AsiaEurope & Central Asia (excluding high income)Europe & Central Asia (IDA & IBRD countries)European UnionFaroe IslandsFijiFinlandFragile and conflict affected situationsFranceFrench PolynesiaGabonGambia, TheGeorgiaGermanyGhanaGreeceGreenlandGrenadaGuamGuatemalaGuineaGuinea-BissauGuyanaHaitiHeavily indebted poor countries (HIPC)High incomeHondurasHong Kong SAR, ChinaHungaryIBRD onlyIcelandIDA & IBRD totalIDA blendIDA onlyIDA totalIndiaIndonesiaIran, Islamic Rep.IraqIrelandIsle of ManIsraelItalyJamaicaJapanJordanKazakhstanKenyaKiribatiKorea, Dem. People’s Rep.Korea, Rep.KosovoKuwaitKyrgyz RepublicLao PDRLate-demographic dividendLatin America & Caribbean Latin America & Caribbean (excluding high income)Latin America & the Caribbean (IDA & IBRD countries)LatviaLeast developed countries: UN classificationLebanonLesothoLiberiaLibyaLiechtensteinLithuaniaLow & middle incomeLow incomeLower middle incomeLuxembourgMacao SAR, ChinaMacedonia, FYRMadagascarMalawiMalaysiaMaldivesMaliMaltaMarshall IslandsMauritaniaMauritiusMexicoMicronesia, Fed. Sts.Middle East & North AfricaMiddle East & North Africa (excluding high income)Middle East & North Africa (IDA & IBRD countries)Middle incomeMoldovaMonacoMongoliaMontenegroMoroccoMozambiqueMyanmarNamibiaNepalNetherlandsNew CaledoniaNew ZealandNicaraguaNigerNigeriaNorth AmericaNorwayOECD membersOmanOther small statesPacific island small statesPakistanPalauPanamaPapua New GuineaParaguayPeruPhilippinesPolandPortugalPost-demographic dividendPre-demographic dividendPuerto RicoQatarRomaniaRussian FederationRwandaSamoaSan MarinoSao Tome and PrincipeSaudi ArabiaSenegalSerbiaSeychellesSierra LeoneSingaporeSint Maarten (Dutch part)Slovak RepublicSloveniaSmall statesSolomon IslandsSomaliaSouth AfricaSouth AsiaSouth Asia (IDA & IBRD)South SudanSpainSri LankaSt. Kitts and NevisSt. LuciaSt. Martin (French part)St. Vincent and the GrenadinesSub-Saharan Africa Sub-Saharan Africa (excluding high income)Sub-Saharan Africa (IDA & IBRD countries)SudanSurinameSwazilandSwedenSwitzerlandSyrian Arab RepublicTajikistanTanzaniaThailandTimor-LesteTogoTongaTrinidad and TobagoTunisiaTurkeyTurkmenistanUgandaUkraineUnited Arab EmiratesUnited KingdomUnited StatesUpper middle incomeUruguayUzbekistanVanuatuVenezuela, RBVietnamVirgin Islands (U.S.)West Bank and GazaWorldYemen, Rep.ZambiaZimbabwe Timeline:
This timeline shows a graph from 1961 to 2015 of Georgia. No data until 1960. Number of actual observations by date: 55.
Source name:
World Development Indicators
Source organization:
(1) United Nations Population Division. World Population Prospects, (2) Census reports and other statistical publications from national statistical offices, (3) Eurostat: Demographic Statistics, (4) United Nations Statistical Division. Population and Vital Statistics Reprot (various years), (5) U.S. Census Bureau: International Database, and (6) Secretariat of the Pacific Community: Statistics and Demography Programme.
Categories, topics:
Health
Last updated:
apr 23, 2017
Indicators value changes by year
Maximum:
13.066
jan 1, 1961
At the date of observation
Value
Absolute change
Change from previous value
jan 1, 1961
13.066
+13.066
0.0%
jan 1, 1962
12.721
-0.345
-2.64%
jan 1, 1963
12.365
-0.356
-2.8%
jan 1, 1964
12.0
-0.365
-2.95%
jan 1, 1965
11.633
-0.367
-3.06%
jan 1, 1966
11.277
-0.356
-3.06%
jan 1, 1967
10.945
-0.332
-2.94%
jan 1, 1968
10.648
-0.297
-2.71%
jan 1, 1969
10.391
-0.257
-2.41%
jan 1, 1970
10.176
-0.215
-2.07%
jan 1, 1971
9.997
-0.179
-1.76%
jan 1, 1972
9.841
-0.156
-1.56%
jan 1, 1973
9.696
-0.145
-1.47%
jan 1, 1974
9.554
-0.142
-1.46%
jan 1, 1975
9.416
-0.138
-1.44%
jan 1, 1976
9.292
-0.124
-1.32%
jan 1, 1977
9.195
-0.097
-1.04%
jan 1, 1978
9.139
-0.056
-0.61%
jan 1, 1979
9.127
-0.012
-0.13%
jan 1, 1980
9.156
+0.029
0.32%
jan 1, 1981
9.211
+0.055
0.6%
jan 1, 1982
9.273
+0.062
0.67%
jan 1, 1983
9.324
+0.051
0.55%
jan 1, 1984
9.352
+0.028
0.3%
jan 1, 1985
9.355
+0.003
0.03%
jan 1, 1986
9.341
-0.014
-0.15%
jan 1, 1987
9.324
-0.017
-0.18%
jan 1, 1988
9.323
-0.001
-0.01%
jan 1, 1989
9.35
+0.027
0.29%
jan 1, 1990
9.406
+0.056
0.6%
jan 1, 1991
9.488
+0.082
0.87%
jan 1, 1992
9.586
+0.098
1.03%
jan 1, 1993
9.687
+0.101
1.05%
jan 1, 1994
9.778
+0.091
0.94%
jan 1, 1995
9.855
+0.077
0.79%
jan 1, 1996
9.914
+0.059
0.6%
jan 1, 1997
9.952
+0.038
0.38%
jan 1, 1998
9.975
+0.023
0.23%
jan 1, 1999
9.992
+0.017
0.17%
jan 1, 2000
10.008
+0.016
0.16%
jan 1, 2001
10.033
+0.025
0.25%
jan 1, 2002
10.078
+0.045
0.45%
jan 1, 2003
10.148
+0.07
0.69%
jan 1, 2004
10.246
+0.098
0.97%
jan 1, 2005
10.37
+0.124
1.21%
jan 1, 2006
10.516
+0.146
1.41%
jan 1, 2007
10.677
+0.161
1.53%
jan 1, 2008
10.841
+0.164
1.54%
jan 1, 2009
10.997
+0.156
1.44%
jan 1, 2010
11.137
+0.14
1.27%
jan 1, 2011
11.257
+0.12
1.08%
jan 1, 2012
11.353
+0.096
0.85%
jan 1, 2013
11.427
+0.074
0.65%
jan 1, 2014
11.481
+0.054
0.47%
jan 1, 2015
11.517
+0.036
0.31%
Ranking of countries by current statistics by years


Comments: