29
/
en
AIzaSyAYiBZKx7MnpbEhh9jyipgxe19OcubqV5w
April 1, 2024
177524
Lesotho
LSO
true
2
1
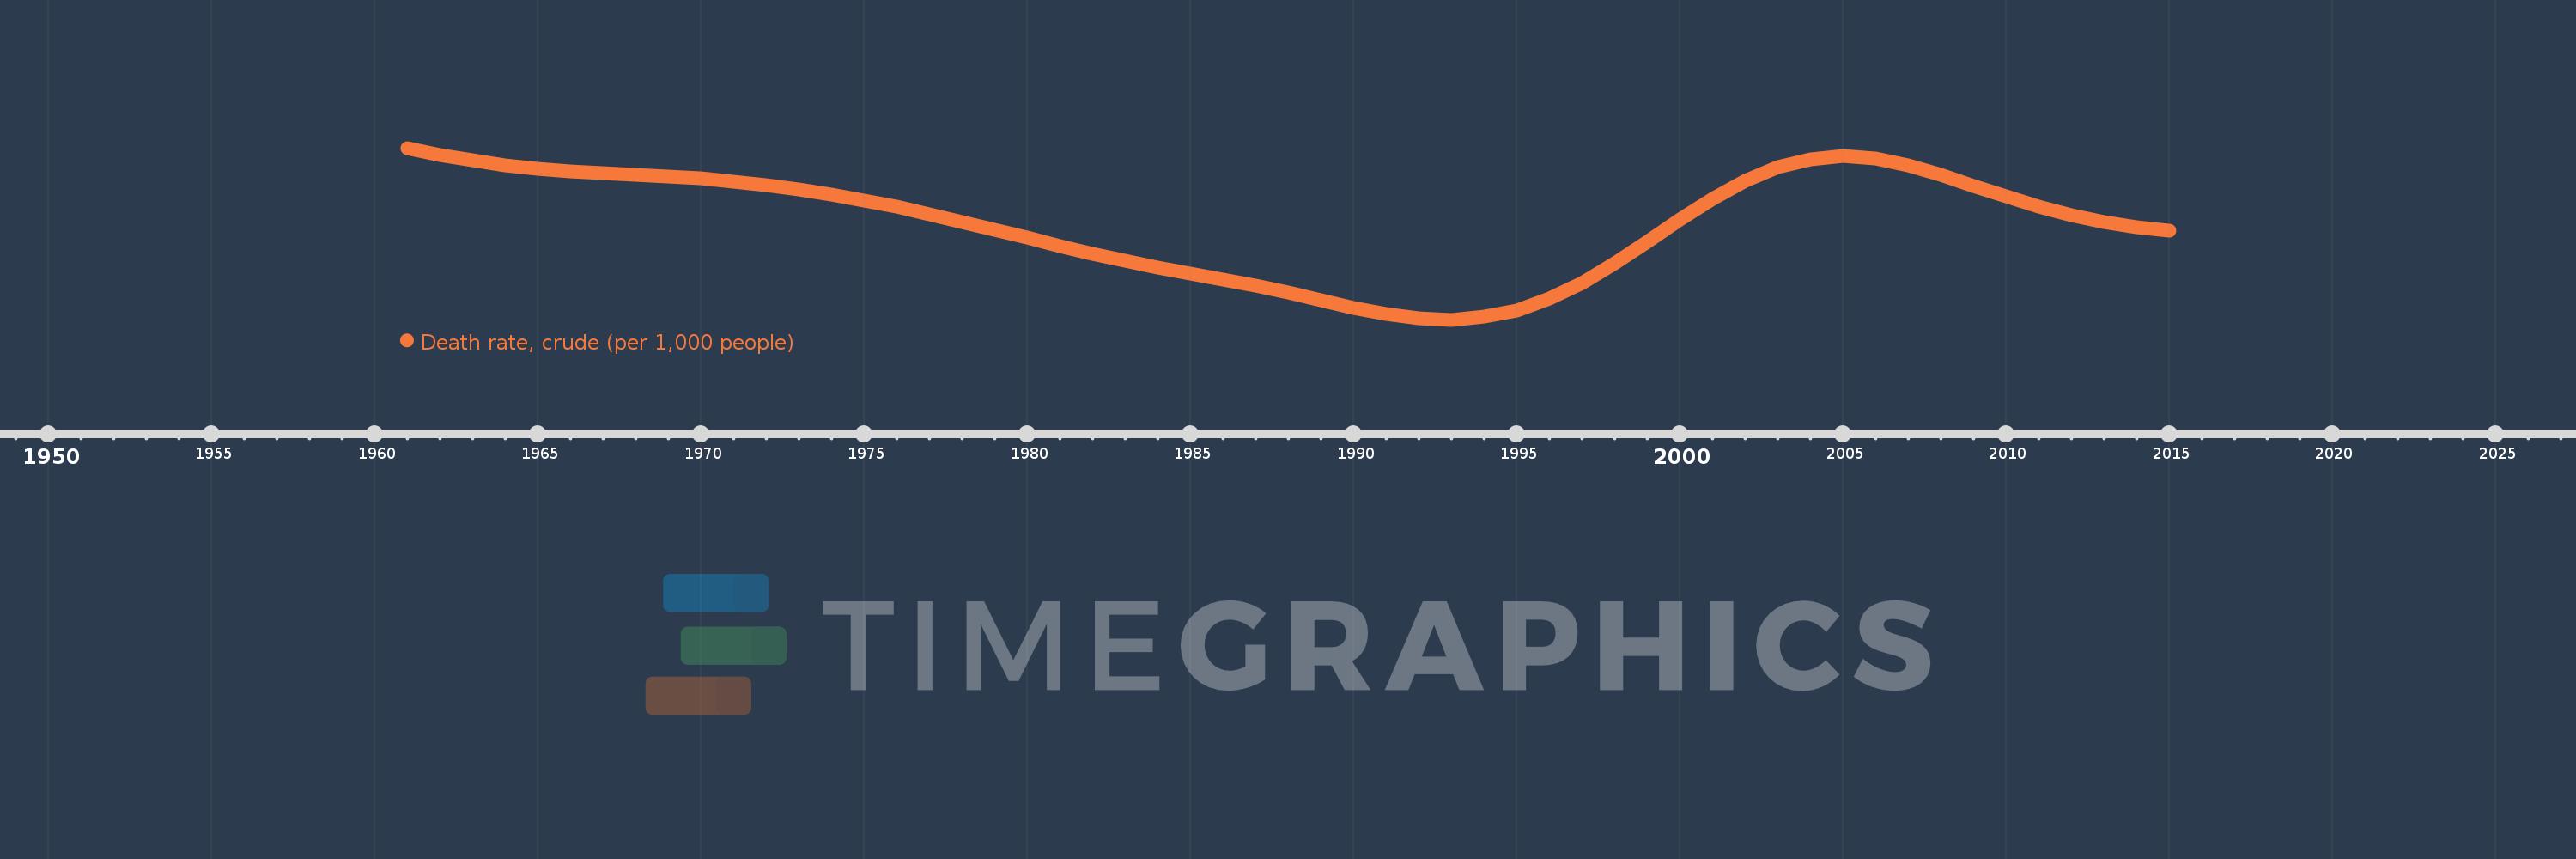
Death rate, crude (per 1,000 people)
2015,2014,2013,2012,2011,2010,2009,2008,2007,2006,2005,2004,2003,2002,2001,2000,1999,1998,1997,1996,1995,1994,1993,1992,1991,1990,1989,1988,1987,1986,1985,1984,1983,1982,1981,1980,1979,1978,1977,1976,1975,1974,1973,1972,1971,1970,1969,1968,1967,1966,1965,1964,1963,1962,1961
This statistics in other country:
AfghanistanAlbaniaAlgeriaAmerican SamoaAndorraAngolaAntigua and BarbudaArab WorldArgentinaArmeniaArubaAustraliaAustriaAzerbaijanBahamas, TheBahrainBangladeshBarbadosBelarusBelgiumBelizeBeninBermudaBhutanBoliviaBosnia and HerzegovinaBotswanaBrazilBrunei DarussalamBulgariaBurkina FasoBurundiCabo VerdeCambodiaCameroonCanadaCaribbean small statesCayman IslandsCentral African RepublicCentral Europe and the BalticsChadChannel IslandsChileChinaColombiaComorosCongo, Dem. Rep.Congo, Rep.Costa RicaCote d'IvoireCroatiaCubaCuracaoCyprusCzech RepublicDenmarkDjiboutiDominicaDominican RepublicEarly-demographic dividendEast Asia & PacificEast Asia & Pacific (excluding high income)East Asia & Pacific (IDA & IBRD countries)EcuadorEgypt, Arab Rep.El SalvadorEquatorial GuineaEritreaEstoniaEthiopiaEuro areaEurope & Central AsiaEurope & Central Asia (excluding high income)Europe & Central Asia (IDA & IBRD countries)European UnionFaroe IslandsFijiFinlandFragile and conflict affected situationsFranceFrench PolynesiaGabonGambia, TheGeorgiaGermanyGhanaGreeceGreenlandGrenadaGuamGuatemalaGuineaGuinea-BissauGuyanaHaitiHeavily indebted poor countries (HIPC)High incomeHondurasHong Kong SAR, ChinaHungaryIBRD onlyIcelandIDA & IBRD totalIDA blendIDA onlyIDA totalIndiaIndonesiaIran, Islamic Rep.IraqIrelandIsle of ManIsraelItalyJamaicaJapanJordanKazakhstanKenyaKiribatiKorea, Dem. People’s Rep.Korea, Rep.KosovoKuwaitKyrgyz RepublicLao PDRLate-demographic dividendLatin America & Caribbean Latin America & Caribbean (excluding high income)Latin America & the Caribbean (IDA & IBRD countries)LatviaLeast developed countries: UN classificationLebanonLesothoLiberiaLibyaLiechtensteinLithuaniaLow & middle incomeLow incomeLower middle incomeLuxembourgMacao SAR, ChinaMacedonia, FYRMadagascarMalawiMalaysiaMaldivesMaliMaltaMarshall IslandsMauritaniaMauritiusMexicoMicronesia, Fed. Sts.Middle East & North AfricaMiddle East & North Africa (excluding high income)Middle East & North Africa (IDA & IBRD countries)Middle incomeMoldovaMonacoMongoliaMontenegroMoroccoMozambiqueMyanmarNamibiaNepalNetherlandsNew CaledoniaNew ZealandNicaraguaNigerNigeriaNorth AmericaNorwayOECD membersOmanOther small statesPacific island small statesPakistanPalauPanamaPapua New GuineaParaguayPeruPhilippinesPolandPortugalPost-demographic dividendPre-demographic dividendPuerto RicoQatarRomaniaRussian FederationRwandaSamoaSan MarinoSao Tome and PrincipeSaudi ArabiaSenegalSerbiaSeychellesSierra LeoneSingaporeSint Maarten (Dutch part)Slovak RepublicSloveniaSmall statesSolomon IslandsSomaliaSouth AfricaSouth AsiaSouth Asia (IDA & IBRD)South SudanSpainSri LankaSt. Kitts and NevisSt. LuciaSt. Martin (French part)St. Vincent and the GrenadinesSub-Saharan Africa Sub-Saharan Africa (excluding high income)Sub-Saharan Africa (IDA & IBRD countries)SudanSurinameSwazilandSwedenSwitzerlandSyrian Arab RepublicTajikistanTanzaniaThailandTimor-LesteTogoTongaTrinidad and TobagoTunisiaTurkeyTurkmenistanUgandaUkraineUnited Arab EmiratesUnited KingdomUnited StatesUpper middle incomeUruguayUzbekistanVanuatuVenezuela, RBVietnamVirgin Islands (U.S.)West Bank and GazaWorldYemen, Rep.ZambiaZimbabwe Timeline:
This timeline shows a graph from 1961 to 2015 of Lesotho. No data until 1960. Number of actual observations by date: 55.
Source name:
World Development Indicators
Source organization:
(1) United Nations Population Division. World Population Prospects, (2) Census reports and other statistical publications from national statistical offices, (3) Eurostat: Demographic Statistics, (4) United Nations Statistical Division. Population and Vital Statistics Reprot (various years), (5) U.S. Census Bureau: International Database, and (6) Secretariat of the Pacific Community: Statistics and Demography Programme.
Categories, topics:
Health
Last updated:
apr 23, 2017
Indicators value changes by year
Minimum:
10.067
jan 1, 1993
Maximum:
19.177
jan 1, 1961
At the date of observation
Value
Absolute change
Change from previous value
jan 1, 1961
19.177
+19.177
0.0%
jan 1, 1962
18.814
-0.363
-1.89%
jan 1, 1963
18.51
-0.304
-1.62%
jan 1, 1964
18.269
-0.241
-1.3%
jan 1, 1965
18.087
-0.182
-1.0%
jan 1, 1966
17.954
-0.133
-0.74%
jan 1, 1967
17.854
-0.1
-0.56%
jan 1, 1968
17.768
-0.086
-0.48%
jan 1, 1969
17.672
-0.096
-0.54%
jan 1, 1970
17.554
-0.118
-0.67%
jan 1, 1971
17.399
-0.155
-0.88%
jan 1, 1972
17.202
-0.197
-1.13%
jan 1, 1973
16.965
-0.237
-1.38%
jan 1, 1974
16.694
-0.271
-1.6%
jan 1, 1975
16.387
-0.307
-1.84%
jan 1, 1976
16.046
-0.341
-2.08%
jan 1, 1977
15.669
-0.377
-2.35%
jan 1, 1978
15.264
-0.405
-2.58%
jan 1, 1979
14.841
-0.423
-2.77%
jan 1, 1980
14.409
-0.432
-2.91%
jan 1, 1981
13.983
-0.426
-2.96%
jan 1, 1982
13.577
-0.406
-2.9%
jan 1, 1983
13.197
-0.38
-2.8%
jan 1, 1984
12.845
-0.352
-2.67%
jan 1, 1985
12.524
-0.321
-2.5%
jan 1, 1986
12.211
-0.313
-2.5%
jan 1, 1987
11.873
-0.338
-2.77%
jan 1, 1988
11.5
-0.373
-3.14%
jan 1, 1989
11.099
-0.401
-3.49%
jan 1, 1990
10.7
-0.399
-3.59%
jan 1, 1991
10.354
-0.346
-3.23%
jan 1, 1992
10.126
-0.228
-2.2%
jan 1, 1993
10.067
-0.059
-0.58%
jan 1, 1994
10.213
+0.146
1.45%
jan 1, 1995
10.577
+0.364
3.56%
jan 1, 1996
11.179
+0.602
5.69%
jan 1, 1997
12.025
+0.846
7.57%
jan 1, 1998
13.06
+1.035
8.61%
jan 1, 1999
14.204
+1.144
8.76%
jan 1, 2000
15.384
+1.18
8.31%
jan 1, 2001
16.496
+1.112
7.23%
jan 1, 2002
17.438
+0.942
5.71%
jan 1, 2003
18.149
+0.711
4.08%
jan 1, 2004
18.591
+0.442
2.44%
jan 1, 2005
18.747
+0.156
0.84%
jan 1, 2006
18.625
-0.122
-0.65%
jan 1, 2007
18.263
-0.362
-1.94%
jan 1, 2008
17.751
-0.512
-2.8%
jan 1, 2009
17.176
-0.575
-3.24%
jan 1, 2010
16.594
-0.582
-3.39%
jan 1, 2011
16.061
-0.533
-3.21%
jan 1, 2012
15.615
-0.446
-2.78%
jan 1, 2013
15.26
-0.355
-2.27%
jan 1, 2014
14.989
-0.271
-1.78%
jan 1, 2015
14.804
-0.185
-1.23%
Ranking of countries by current statistics by years


Comments: