29
/
en
AIzaSyAYiBZKx7MnpbEhh9jyipgxe19OcubqV5w
April 1, 2024
65826
Algeria
DZA
true
2
1
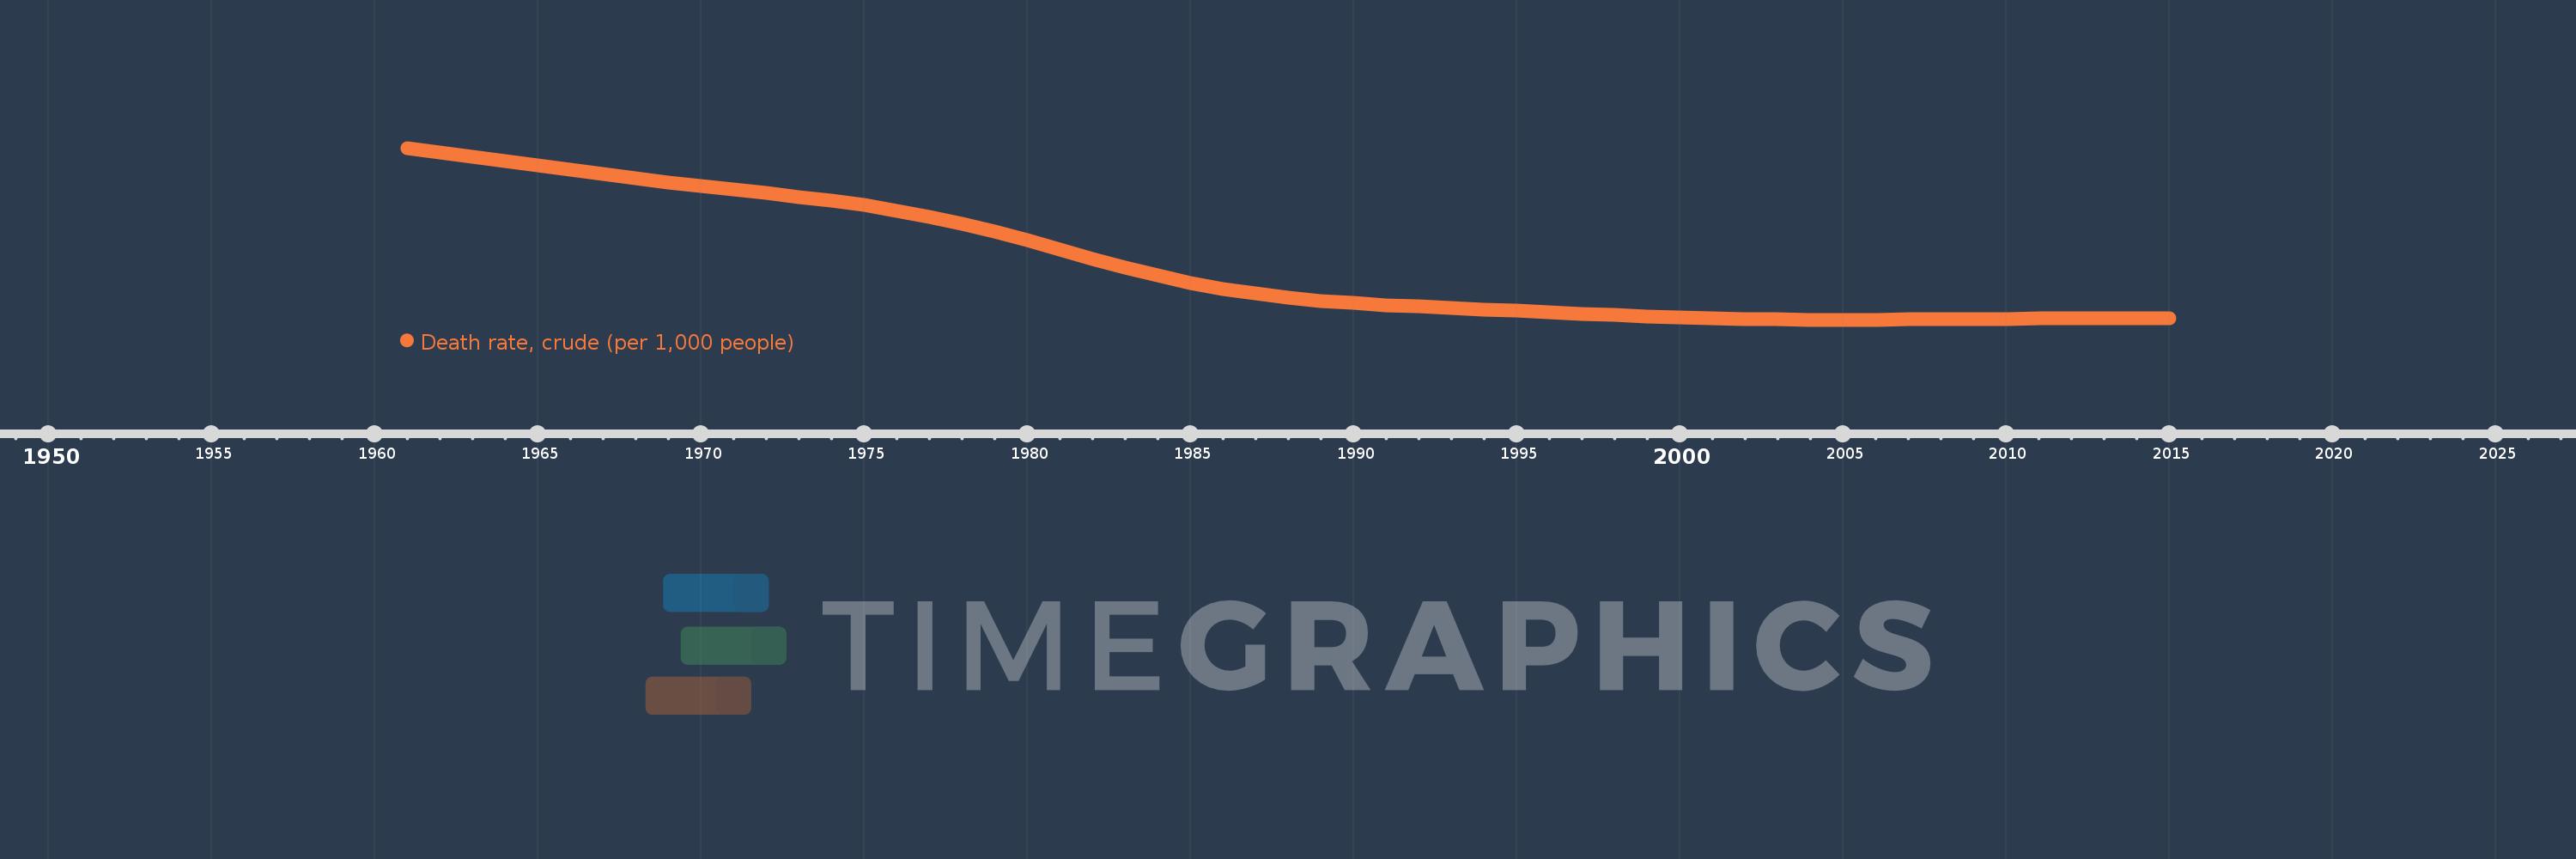
Death rate, crude (per 1,000 people)
2015,2014,2013,2012,2011,2010,2009,2008,2007,2006,2005,2004,2003,2002,2001,2000,1999,1998,1997,1996,1995,1994,1993,1992,1991,1990,1989,1988,1987,1986,1985,1984,1983,1982,1981,1980,1979,1978,1977,1976,1975,1974,1973,1972,1971,1970,1969,1968,1967,1966,1965,1964,1963,1962,1961
This statistics in other country:
AfghanistanAlbaniaAlgeriaAmerican SamoaAndorraAngolaAntigua and BarbudaArab WorldArgentinaArmeniaArubaAustraliaAustriaAzerbaijanBahamas, TheBahrainBangladeshBarbadosBelarusBelgiumBelizeBeninBermudaBhutanBoliviaBosnia and HerzegovinaBotswanaBrazilBrunei DarussalamBulgariaBurkina FasoBurundiCabo VerdeCambodiaCameroonCanadaCaribbean small statesCayman IslandsCentral African RepublicCentral Europe and the BalticsChadChannel IslandsChileChinaColombiaComorosCongo, Dem. Rep.Congo, Rep.Costa RicaCote d'IvoireCroatiaCubaCuracaoCyprusCzech RepublicDenmarkDjiboutiDominicaDominican RepublicEarly-demographic dividendEast Asia & PacificEast Asia & Pacific (excluding high income)East Asia & Pacific (IDA & IBRD countries)EcuadorEgypt, Arab Rep.El SalvadorEquatorial GuineaEritreaEstoniaEthiopiaEuro areaEurope & Central AsiaEurope & Central Asia (excluding high income)Europe & Central Asia (IDA & IBRD countries)European UnionFaroe IslandsFijiFinlandFragile and conflict affected situationsFranceFrench PolynesiaGabonGambia, TheGeorgiaGermanyGhanaGreeceGreenlandGrenadaGuamGuatemalaGuineaGuinea-BissauGuyanaHaitiHeavily indebted poor countries (HIPC)High incomeHondurasHong Kong SAR, ChinaHungaryIBRD onlyIcelandIDA & IBRD totalIDA blendIDA onlyIDA totalIndiaIndonesiaIran, Islamic Rep.IraqIrelandIsle of ManIsraelItalyJamaicaJapanJordanKazakhstanKenyaKiribatiKorea, Dem. People’s Rep.Korea, Rep.KosovoKuwaitKyrgyz RepublicLao PDRLate-demographic dividendLatin America & Caribbean Latin America & Caribbean (excluding high income)Latin America & the Caribbean (IDA & IBRD countries)LatviaLeast developed countries: UN classificationLebanonLesothoLiberiaLibyaLiechtensteinLithuaniaLow & middle incomeLow incomeLower middle incomeLuxembourgMacao SAR, ChinaMacedonia, FYRMadagascarMalawiMalaysiaMaldivesMaliMaltaMarshall IslandsMauritaniaMauritiusMexicoMicronesia, Fed. Sts.Middle East & North AfricaMiddle East & North Africa (excluding high income)Middle East & North Africa (IDA & IBRD countries)Middle incomeMoldovaMonacoMongoliaMontenegroMoroccoMozambiqueMyanmarNamibiaNepalNetherlandsNew CaledoniaNew ZealandNicaraguaNigerNigeriaNorth AmericaNorwayOECD membersOmanOther small statesPacific island small statesPakistanPalauPanamaPapua New GuineaParaguayPeruPhilippinesPolandPortugalPost-demographic dividendPre-demographic dividendPuerto RicoQatarRomaniaRussian FederationRwandaSamoaSan MarinoSao Tome and PrincipeSaudi ArabiaSenegalSerbiaSeychellesSierra LeoneSingaporeSint Maarten (Dutch part)Slovak RepublicSloveniaSmall statesSolomon IslandsSomaliaSouth AfricaSouth AsiaSouth Asia (IDA & IBRD)South SudanSpainSri LankaSt. Kitts and NevisSt. LuciaSt. Martin (French part)St. Vincent and the GrenadinesSub-Saharan Africa Sub-Saharan Africa (excluding high income)Sub-Saharan Africa (IDA & IBRD countries)SudanSurinameSwazilandSwedenSwitzerlandSyrian Arab RepublicTajikistanTanzaniaThailandTimor-LesteTogoTongaTrinidad and TobagoTunisiaTurkeyTurkmenistanUgandaUkraineUnited Arab EmiratesUnited KingdomUnited StatesUpper middle incomeUruguayUzbekistanVanuatuVenezuela, RBVietnamVirgin Islands (U.S.)West Bank and GazaWorldYemen, Rep.ZambiaZimbabwe Timeline:
This timeline shows a graph from 1961 to 2015 of Algeria. No data until 1960. Number of actual observations by date: 55.
Source name:
World Development Indicators
Source organization:
(1) United Nations Population Division. World Population Prospects, (2) Census reports and other statistical publications from national statistical offices, (3) Eurostat: Demographic Statistics, (4) United Nations Statistical Division. Population and Vital Statistics Reprot (various years), (5) U.S. Census Bureau: International Database, and (6) Secretariat of the Pacific Community: Statistics and Demography Programme.
Categories, topics:
Health
Last updated:
apr 23, 2017
Indicators value changes by year
Maximum:
20.341
jan 1, 1961
At the date of observation
Value
Absolute change
Change from previous value
jan 1, 1961
20.341
+20.341
0.0%
jan 1, 1962
19.952
-0.389
-1.91%
jan 1, 1963
19.557
-0.395
-1.98%
jan 1, 1964
19.158
-0.399
-2.04%
jan 1, 1965
18.757
-0.401
-2.09%
jan 1, 1966
18.363
-0.394
-2.1%
jan 1, 1967
17.985
-0.378
-2.06%
jan 1, 1968
17.625
-0.36
-2.0%
jan 1, 1969
17.283
-0.342
-1.94%
jan 1, 1970
16.955
-0.328
-1.9%
jan 1, 1971
16.633
-0.322
-1.9%
jan 1, 1972
16.312
-0.321
-1.93%
jan 1, 1973
15.979
-0.333
-2.04%
jan 1, 1974
15.618
-0.361
-2.26%
jan 1, 1975
15.217
-0.401
-2.57%
jan 1, 1976
14.752
-0.465
-3.06%
jan 1, 1977
14.202
-0.55
-3.73%
jan 1, 1978
13.564
-0.638
-4.49%
jan 1, 1979
12.849
-0.715
-5.27%
jan 1, 1980
12.072
-0.777
-6.05%
jan 1, 1981
11.259
-0.813
-6.73%
jan 1, 1982
10.443
-0.816
-7.25%
jan 1, 1983
9.658
-0.785
-7.52%
jan 1, 1984
8.935
-0.723
-7.49%
jan 1, 1985
8.295
-0.64
-7.16%
jan 1, 1986
7.754
-0.541
-6.52%
jan 1, 1987
7.318
-0.436
-5.62%
jan 1, 1988
6.972
-0.346
-4.73%
jan 1, 1989
6.695
-0.277
-3.97%
jan 1, 1990
6.479
-0.216
-3.23%
jan 1, 1991
6.307
-0.172
-2.65%
jan 1, 1992
6.164
-0.143
-2.27%
jan 1, 1993
6.037
-0.127
-2.06%
jan 1, 1994
5.915
-0.122
-2.02%
jan 1, 1995
5.79
-0.125
-2.11%
jan 1, 1996
5.66
-0.13
-2.25%
jan 1, 1997
5.526
-0.134
-2.37%
jan 1, 1998
5.4
-0.126
-2.28%
jan 1, 1999
5.287
-0.113
-2.09%
jan 1, 2000
5.192
-0.095
-1.8%
jan 1, 2001
5.115
-0.077
-1.48%
jan 1, 2002
5.059
-0.056
-1.09%
jan 1, 2003
5.022
-0.037
-0.73%
jan 1, 2004
5.001
-0.021
-0.42%
jan 1, 2005
4.994
-0.007
-0.14%
jan 1, 2006
4.999
+0.005
0.1%
jan 1, 2007
5.014
+0.015
0.3%
jan 1, 2008
5.036
+0.022
0.44%
jan 1, 2009
5.061
+0.025
0.5%
jan 1, 2010
5.086
+0.025
0.49%
jan 1, 2011
5.108
+0.022
0.43%
jan 1, 2012
5.123
+0.015
0.29%
jan 1, 2013
5.13
+0.007
0.14%
jan 1, 2014
5.131
+0.001
0.02%
jan 1, 2015
5.125
-0.006
-0.12%
Ranking of countries by current statistics by years


Comments: