29
/
en
AIzaSyAYiBZKx7MnpbEhh9jyipgxe19OcubqV5w
April 1, 2024
285725
Zambia
ZMB
true
2
1
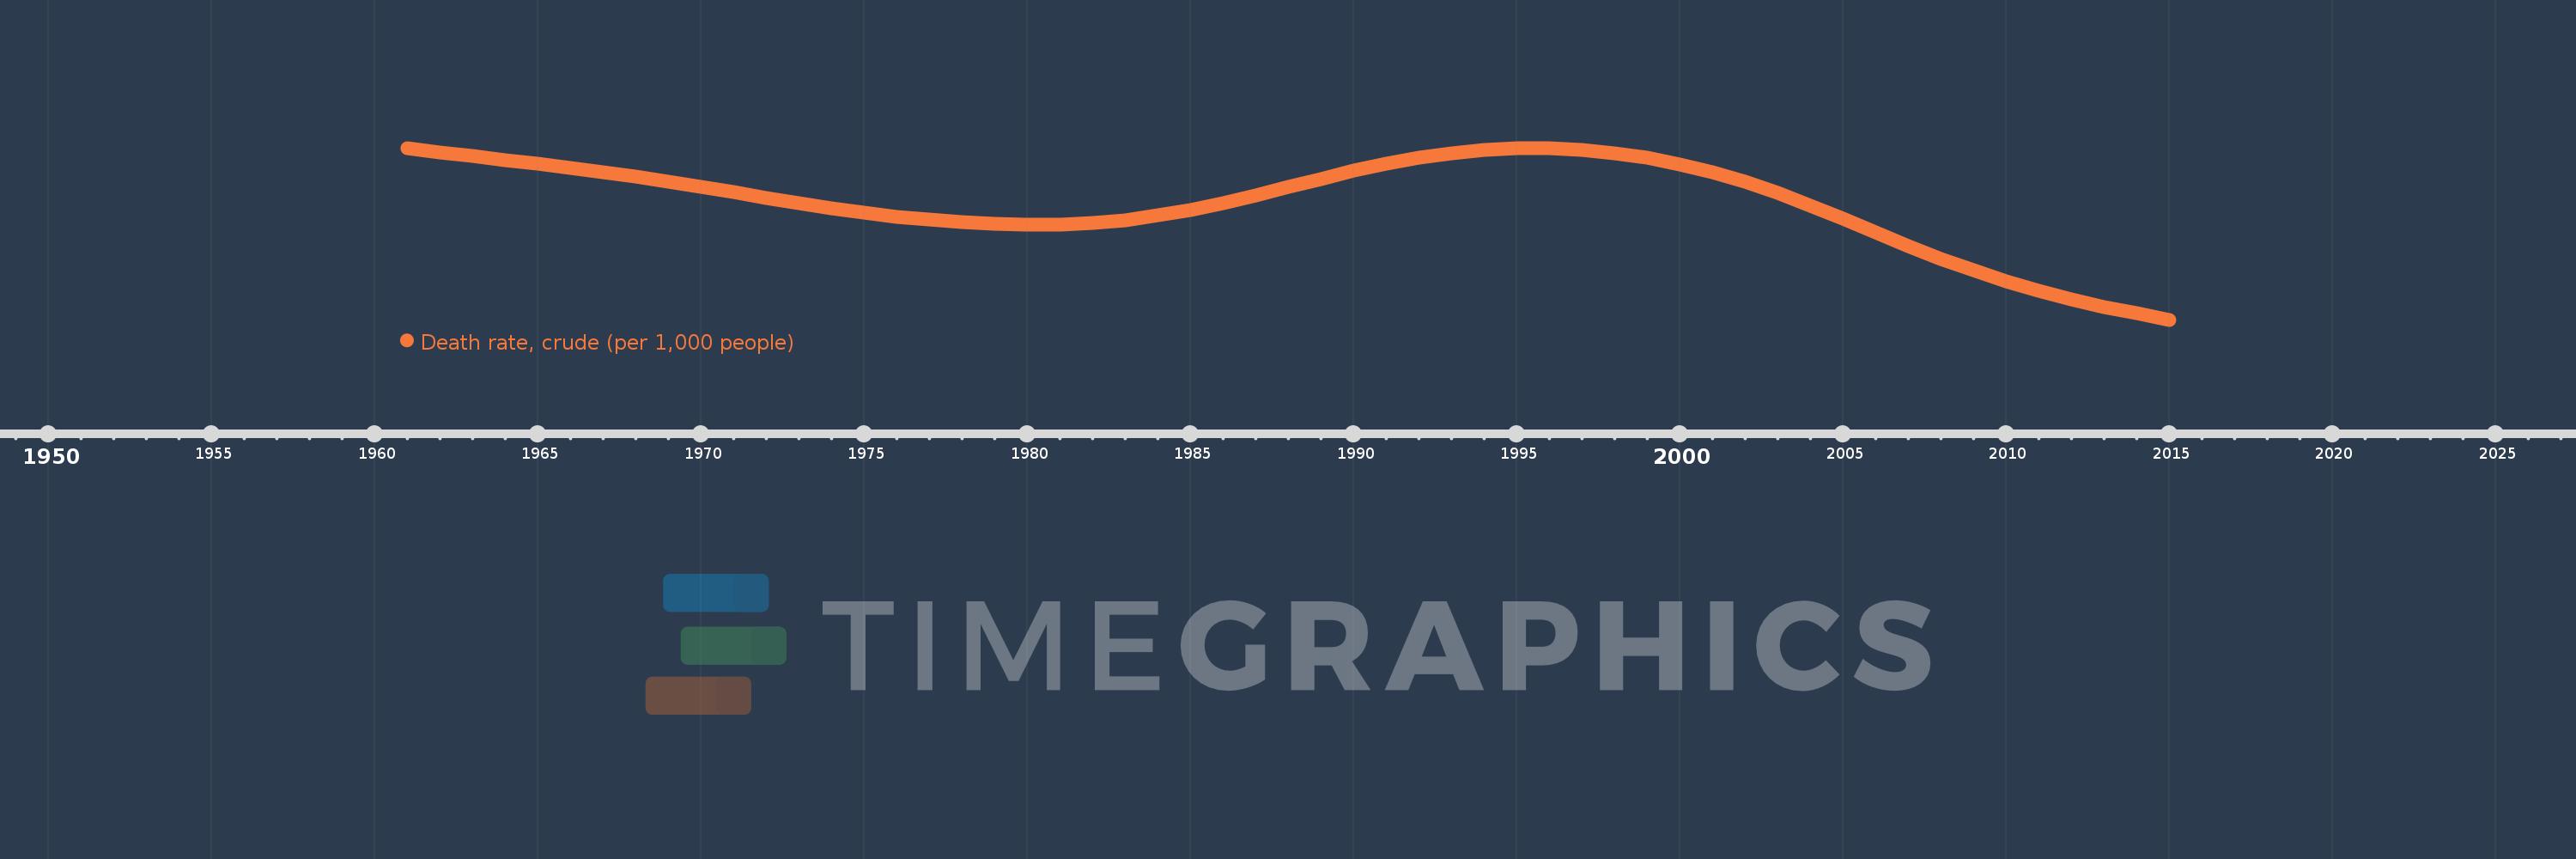
Death rate, crude (per 1,000 people)
2015,2014,2013,2012,2011,2010,2009,2008,2007,2006,2005,2004,2003,2002,2001,2000,1999,1998,1997,1996,1995,1994,1993,1992,1991,1990,1989,1988,1987,1986,1985,1984,1983,1982,1981,1980,1979,1978,1977,1976,1975,1974,1973,1972,1971,1970,1969,1968,1967,1966,1965,1964,1963,1962,1961
This statistics in other country:
AfghanistanAlbaniaAlgeriaAmerican SamoaAndorraAngolaAntigua and BarbudaArab WorldArgentinaArmeniaArubaAustraliaAustriaAzerbaijanBahamas, TheBahrainBangladeshBarbadosBelarusBelgiumBelizeBeninBermudaBhutanBoliviaBosnia and HerzegovinaBotswanaBrazilBrunei DarussalamBulgariaBurkina FasoBurundiCabo VerdeCambodiaCameroonCanadaCaribbean small statesCayman IslandsCentral African RepublicCentral Europe and the BalticsChadChannel IslandsChileChinaColombiaComorosCongo, Dem. Rep.Congo, Rep.Costa RicaCote d'IvoireCroatiaCubaCuracaoCyprusCzech RepublicDenmarkDjiboutiDominicaDominican RepublicEarly-demographic dividendEast Asia & PacificEast Asia & Pacific (excluding high income)East Asia & Pacific (IDA & IBRD countries)EcuadorEgypt, Arab Rep.El SalvadorEquatorial GuineaEritreaEstoniaEthiopiaEuro areaEurope & Central AsiaEurope & Central Asia (excluding high income)Europe & Central Asia (IDA & IBRD countries)European UnionFaroe IslandsFijiFinlandFragile and conflict affected situationsFranceFrench PolynesiaGabonGambia, TheGeorgiaGermanyGhanaGreeceGreenlandGrenadaGuamGuatemalaGuineaGuinea-BissauGuyanaHaitiHeavily indebted poor countries (HIPC)High incomeHondurasHong Kong SAR, ChinaHungaryIBRD onlyIcelandIDA & IBRD totalIDA blendIDA onlyIDA totalIndiaIndonesiaIran, Islamic Rep.IraqIrelandIsle of ManIsraelItalyJamaicaJapanJordanKazakhstanKenyaKiribatiKorea, Dem. People’s Rep.Korea, Rep.KosovoKuwaitKyrgyz RepublicLao PDRLate-demographic dividendLatin America & Caribbean Latin America & Caribbean (excluding high income)Latin America & the Caribbean (IDA & IBRD countries)LatviaLeast developed countries: UN classificationLebanonLesothoLiberiaLibyaLiechtensteinLithuaniaLow & middle incomeLow incomeLower middle incomeLuxembourgMacao SAR, ChinaMacedonia, FYRMadagascarMalawiMalaysiaMaldivesMaliMaltaMarshall IslandsMauritaniaMauritiusMexicoMicronesia, Fed. Sts.Middle East & North AfricaMiddle East & North Africa (excluding high income)Middle East & North Africa (IDA & IBRD countries)Middle incomeMoldovaMonacoMongoliaMontenegroMoroccoMozambiqueMyanmarNamibiaNepalNetherlandsNew CaledoniaNew ZealandNicaraguaNigerNigeriaNorth AmericaNorwayOECD membersOmanOther small statesPacific island small statesPakistanPalauPanamaPapua New GuineaParaguayPeruPhilippinesPolandPortugalPost-demographic dividendPre-demographic dividendPuerto RicoQatarRomaniaRussian FederationRwandaSamoaSan MarinoSao Tome and PrincipeSaudi ArabiaSenegalSerbiaSeychellesSierra LeoneSingaporeSint Maarten (Dutch part)Slovak RepublicSloveniaSmall statesSolomon IslandsSomaliaSouth AfricaSouth AsiaSouth Asia (IDA & IBRD)South SudanSpainSri LankaSt. Kitts and NevisSt. LuciaSt. Martin (French part)St. Vincent and the GrenadinesSub-Saharan Africa Sub-Saharan Africa (excluding high income)Sub-Saharan Africa (IDA & IBRD countries)SudanSurinameSwazilandSwedenSwitzerlandSyrian Arab RepublicTajikistanTanzaniaThailandTimor-LesteTogoTongaTrinidad and TobagoTunisiaTurkeyTurkmenistanUgandaUkraineUnited Arab EmiratesUnited KingdomUnited StatesUpper middle incomeUruguayUzbekistanVanuatuVenezuela, RBVietnamVirgin Islands (U.S.)West Bank and GazaWorldYemen, Rep.ZambiaZimbabwe Timeline:
This timeline shows a graph from 1961 to 2015 of Zambia. No data until 1960. Number of actual observations by date: 55.
Source name:
World Development Indicators
Source organization:
(1) United Nations Population Division. World Population Prospects, (2) Census reports and other statistical publications from national statistical offices, (3) Eurostat: Demographic Statistics, (4) United Nations Statistical Division. Population and Vital Statistics Reprot (various years), (5) U.S. Census Bureau: International Database, and (6) Secretariat of the Pacific Community: Statistics and Demography Programme.
Categories, topics:
Health
Last updated:
apr 23, 2017
Indicators value changes by year
Maximum:
19.649
jan 1, 1996
At the date of observation
Value
Absolute change
Change from previous value
jan 1, 1961
19.641
+19.641
0.0%
jan 1, 1962
19.381
-0.26
-1.32%
jan 1, 1963
19.133
-0.248
-1.28%
jan 1, 1964
18.894
-0.239
-1.25%
jan 1, 1965
18.66
-0.234
-1.24%
jan 1, 1966
18.421
-0.239
-1.28%
jan 1, 1967
18.164
-0.257
-1.4%
jan 1, 1968
17.884
-0.28
-1.54%
jan 1, 1969
17.581
-0.303
-1.69%
jan 1, 1970
17.257
-0.324
-1.84%
jan 1, 1971
16.918
-0.339
-1.96%
jan 1, 1972
16.573
-0.345
-2.04%
jan 1, 1973
16.236
-0.337
-2.03%
jan 1, 1974
15.92
-0.316
-1.95%
jan 1, 1975
15.639
-0.281
-1.77%
jan 1, 1976
15.397
-0.242
-1.55%
jan 1, 1977
15.198
-0.199
-1.29%
jan 1, 1978
15.042
-0.156
-1.03%
jan 1, 1979
14.933
-0.109
-0.72%
jan 1, 1980
14.878
-0.055
-0.37%
jan 1, 1981
14.893
+0.015
0.1%
jan 1, 1982
14.996
+0.103
0.69%
jan 1, 1983
15.19
+0.194
1.29%
jan 1, 1984
15.47
+0.28
1.84%
jan 1, 1985
15.827
+0.357
2.31%
jan 1, 1986
16.251
+0.424
2.68%
jan 1, 1987
16.729
+0.478
2.94%
jan 1, 1988
17.236
+0.507
3.03%
jan 1, 1989
17.744
+0.508
2.95%
jan 1, 1990
18.227
+0.483
2.72%
jan 1, 1991
18.659
+0.432
2.37%
jan 1, 1992
19.025
+0.366
1.96%
jan 1, 1993
19.317
+0.292
1.53%
jan 1, 1994
19.527
+0.21
1.09%
jan 1, 1995
19.641
+0.114
0.58%
jan 1, 1996
19.649
+0.008
0.04%
jan 1, 1997
19.545
-0.104
-0.53%
jan 1, 1998
19.337
-0.208
-1.06%
jan 1, 1999
19.033
-0.304
-1.57%
jan 1, 2000
18.636
-0.397
-2.09%
jan 1, 2001
18.143
-0.493
-2.65%
jan 1, 2002
17.546
-0.597
-3.29%
jan 1, 2003
16.855
-0.691
-3.94%
jan 1, 2004
16.087
-0.768
-4.56%
jan 1, 2005
15.268
-0.819
-5.09%
jan 1, 2006
14.428
-0.84
-5.5%
jan 1, 2007
13.598
-0.83
-5.75%
jan 1, 2008
12.801
-0.797
-5.86%
jan 1, 2009
12.06
-0.741
-5.79%
jan 1, 2010
11.391
-0.669
-5.55%
jan 1, 2011
10.799
-0.592
-5.2%
jan 1, 2012
10.283
-0.516
-4.78%
jan 1, 2013
9.822
-0.461
-4.48%
jan 1, 2014
9.402
-0.42
-4.28%
jan 1, 2015
9.018
-0.384
-4.08%
Ranking of countries by current statistics by years


Comments: