29
/
en
AIzaSyAYiBZKx7MnpbEhh9jyipgxe19OcubqV5w
April 1, 2024
142865
Grenada
GRD
true
2
1
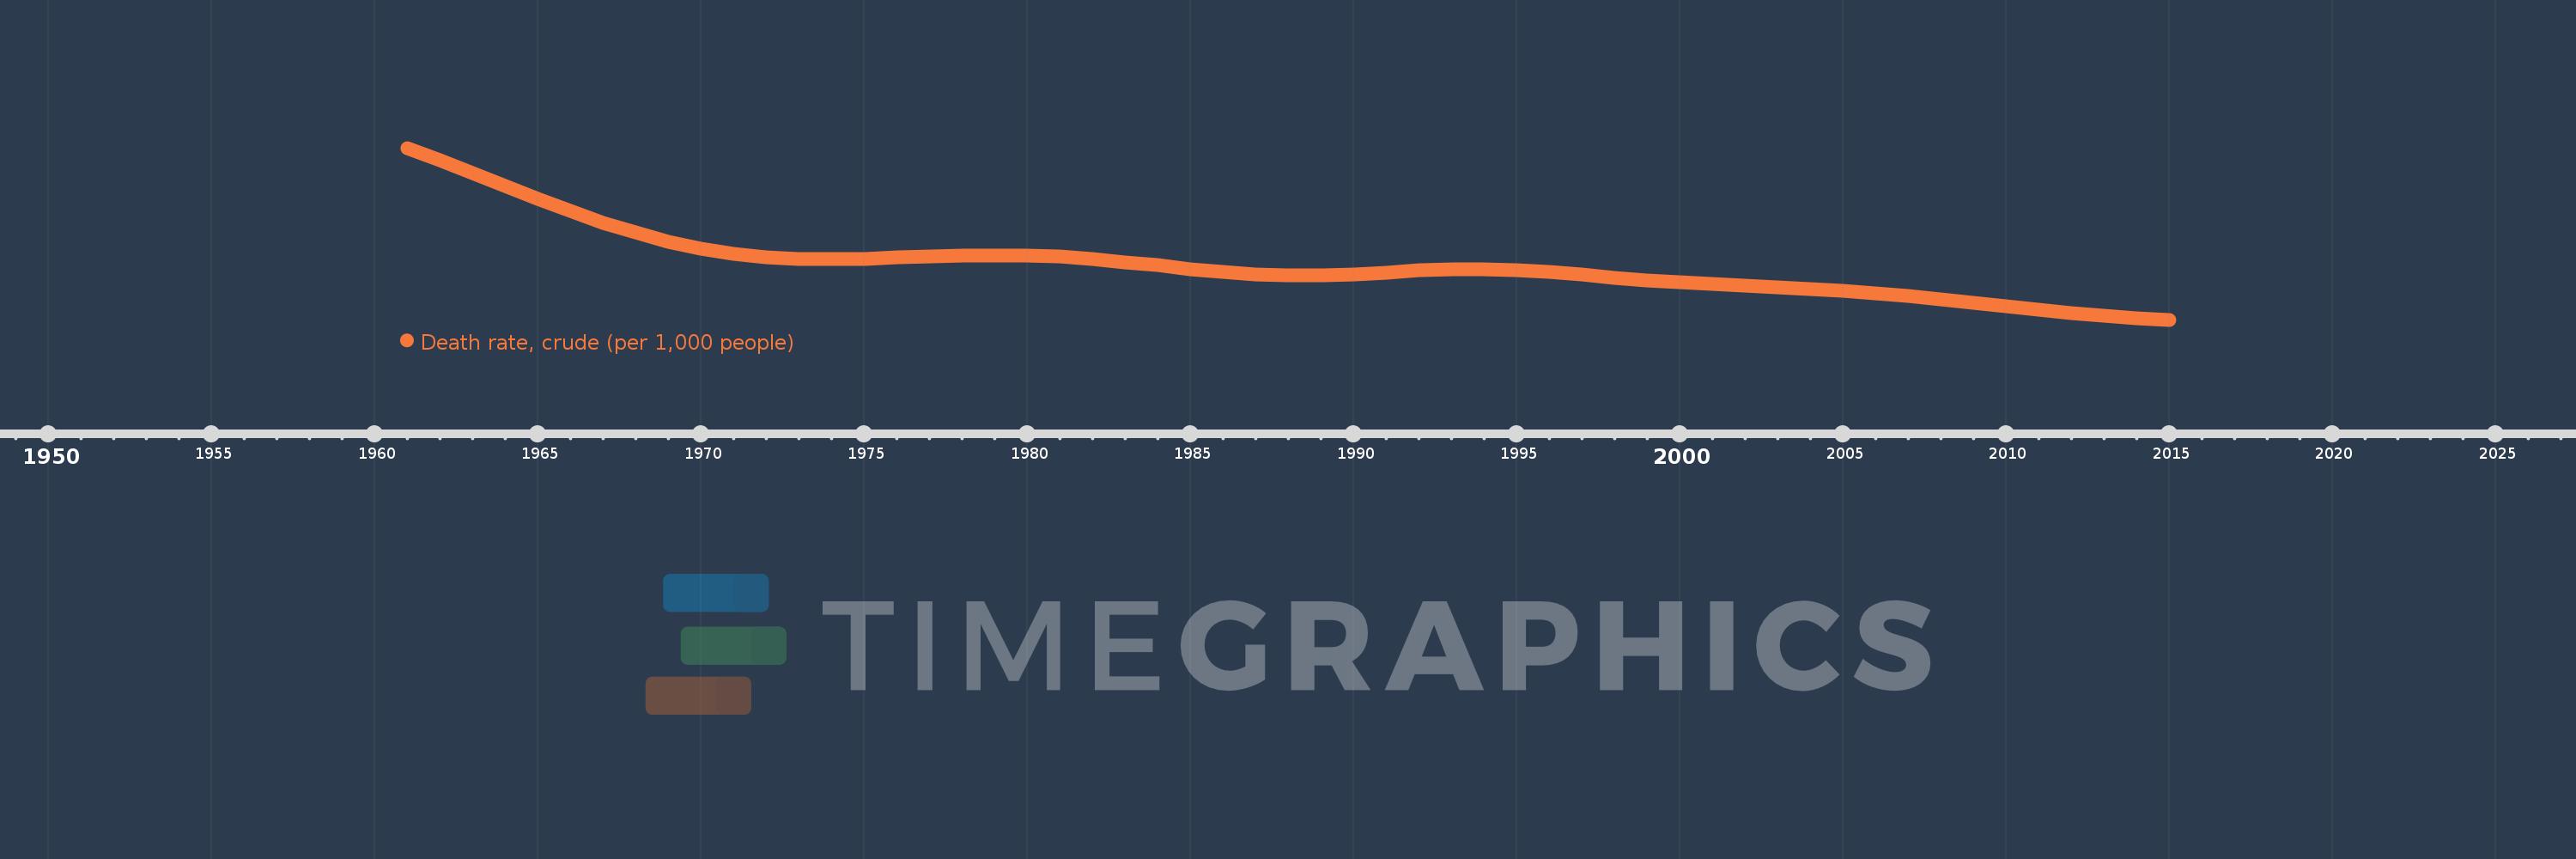
Death rate, crude (per 1,000 people)
2015,2014,2013,2012,2011,2010,2009,2008,2007,2006,2005,2004,2003,2002,2001,2000,1999,1998,1997,1996,1995,1994,1993,1992,1991,1990,1989,1988,1987,1986,1985,1984,1983,1982,1981,1980,1979,1978,1977,1976,1975,1974,1973,1972,1971,1970,1969,1968,1967,1966,1965,1964,1963,1962,1961
This statistics in other country:
AfghanistanAlbaniaAlgeriaAmerican SamoaAndorraAngolaAntigua and BarbudaArab WorldArgentinaArmeniaArubaAustraliaAustriaAzerbaijanBahamas, TheBahrainBangladeshBarbadosBelarusBelgiumBelizeBeninBermudaBhutanBoliviaBosnia and HerzegovinaBotswanaBrazilBrunei DarussalamBulgariaBurkina FasoBurundiCabo VerdeCambodiaCameroonCanadaCaribbean small statesCayman IslandsCentral African RepublicCentral Europe and the BalticsChadChannel IslandsChileChinaColombiaComorosCongo, Dem. Rep.Congo, Rep.Costa RicaCote d'IvoireCroatiaCubaCuracaoCyprusCzech RepublicDenmarkDjiboutiDominicaDominican RepublicEarly-demographic dividendEast Asia & PacificEast Asia & Pacific (excluding high income)East Asia & Pacific (IDA & IBRD countries)EcuadorEgypt, Arab Rep.El SalvadorEquatorial GuineaEritreaEstoniaEthiopiaEuro areaEurope & Central AsiaEurope & Central Asia (excluding high income)Europe & Central Asia (IDA & IBRD countries)European UnionFaroe IslandsFijiFinlandFragile and conflict affected situationsFranceFrench PolynesiaGabonGambia, TheGeorgiaGermanyGhanaGreeceGreenlandGrenadaGuamGuatemalaGuineaGuinea-BissauGuyanaHaitiHeavily indebted poor countries (HIPC)High incomeHondurasHong Kong SAR, ChinaHungaryIBRD onlyIcelandIDA & IBRD totalIDA blendIDA onlyIDA totalIndiaIndonesiaIran, Islamic Rep.IraqIrelandIsle of ManIsraelItalyJamaicaJapanJordanKazakhstanKenyaKiribatiKorea, Dem. People’s Rep.Korea, Rep.KosovoKuwaitKyrgyz RepublicLao PDRLate-demographic dividendLatin America & Caribbean Latin America & Caribbean (excluding high income)Latin America & the Caribbean (IDA & IBRD countries)LatviaLeast developed countries: UN classificationLebanonLesothoLiberiaLibyaLiechtensteinLithuaniaLow & middle incomeLow incomeLower middle incomeLuxembourgMacao SAR, ChinaMacedonia, FYRMadagascarMalawiMalaysiaMaldivesMaliMaltaMarshall IslandsMauritaniaMauritiusMexicoMicronesia, Fed. Sts.Middle East & North AfricaMiddle East & North Africa (excluding high income)Middle East & North Africa (IDA & IBRD countries)Middle incomeMoldovaMonacoMongoliaMontenegroMoroccoMozambiqueMyanmarNamibiaNepalNetherlandsNew CaledoniaNew ZealandNicaraguaNigerNigeriaNorth AmericaNorwayOECD membersOmanOther small statesPacific island small statesPakistanPalauPanamaPapua New GuineaParaguayPeruPhilippinesPolandPortugalPost-demographic dividendPre-demographic dividendPuerto RicoQatarRomaniaRussian FederationRwandaSamoaSan MarinoSao Tome and PrincipeSaudi ArabiaSenegalSerbiaSeychellesSierra LeoneSingaporeSint Maarten (Dutch part)Slovak RepublicSloveniaSmall statesSolomon IslandsSomaliaSouth AfricaSouth AsiaSouth Asia (IDA & IBRD)South SudanSpainSri LankaSt. Kitts and NevisSt. LuciaSt. Martin (French part)St. Vincent and the GrenadinesSub-Saharan Africa Sub-Saharan Africa (excluding high income)Sub-Saharan Africa (IDA & IBRD countries)SudanSurinameSwazilandSwedenSwitzerlandSyrian Arab RepublicTajikistanTanzaniaThailandTimor-LesteTogoTongaTrinidad and TobagoTunisiaTurkeyTurkmenistanUgandaUkraineUnited Arab EmiratesUnited KingdomUnited StatesUpper middle incomeUruguayUzbekistanVanuatuVenezuela, RBVietnamVirgin Islands (U.S.)West Bank and GazaWorldYemen, Rep.ZambiaZimbabwe Timeline:
This timeline shows a graph from 1961 to 2015 of Grenada. No data until 1960. Number of actual observations by date: 55.
Source name:
World Development Indicators
Source organization:
(1) United Nations Population Division. World Population Prospects, (2) Census reports and other statistical publications from national statistical offices, (3) Eurostat: Demographic Statistics, (4) United Nations Statistical Division. Population and Vital Statistics Reprot (various years), (5) U.S. Census Bureau: International Database, and (6) Secretariat of the Pacific Community: Statistics and Demography Programme.
Categories, topics:
Health
Last updated:
apr 23, 2017
Indicators value changes by year
Maximum:
12.174
jan 1, 1961
At the date of observation
Value
Absolute change
Change from previous value
jan 1, 1961
12.174
+12.174
0.0%
jan 1, 1962
11.807
-0.367
-3.01%
jan 1, 1963
11.432
-0.375
-3.18%
jan 1, 1964
11.054
-0.378
-3.31%
jan 1, 1965
10.681
-0.373
-3.37%
jan 1, 1966
10.323
-0.358
-3.35%
jan 1, 1967
9.991
-0.332
-3.22%
jan 1, 1968
9.695
-0.296
-2.96%
jan 1, 1969
9.442
-0.253
-2.61%
jan 1, 1970
9.236
-0.206
-2.18%
jan 1, 1971
9.083
-0.153
-1.66%
jan 1, 1972
8.986
-0.097
-1.07%
jan 1, 1973
8.936
-0.05
-0.56%
jan 1, 1974
8.923
-0.013
-0.15%
jan 1, 1975
8.938
+0.015
0.17%
jan 1, 1976
8.968
+0.03
0.34%
jan 1, 1977
9.0
+0.032
0.36%
jan 1, 1978
9.027
+0.027
0.3%
jan 1, 1979
9.038
+0.011
0.12%
jan 1, 1980
9.029
-0.009
-0.1%
jan 1, 1981
8.993
-0.036
-0.4%
jan 1, 1982
8.928
-0.065
-0.72%
jan 1, 1983
8.841
-0.087
-0.97%
jan 1, 1984
8.742
-0.099
-1.12%
jan 1, 1985
8.639
-0.103
-1.18%
jan 1, 1986
8.546
-0.093
-1.08%
jan 1, 1987
8.48
-0.066
-0.77%
jan 1, 1988
8.447
-0.033
-0.39%
jan 1, 1989
8.45
+0.003
0.04%
jan 1, 1990
8.486
+0.036
0.43%
jan 1, 1991
8.54
+0.054
0.64%
jan 1, 1992
8.595
+0.055
0.64%
jan 1, 1993
8.631
+0.036
0.42%
jan 1, 1994
8.636
+0.005
0.06%
jan 1, 1995
8.607
-0.029
-0.34%
jan 1, 1996
8.547
-0.06
-0.7%
jan 1, 1997
8.467
-0.08
-0.94%
jan 1, 1998
8.383
-0.084
-0.99%
jan 1, 1999
8.307
-0.076
-0.91%
jan 1, 2000
8.244
-0.063
-0.76%
jan 1, 2001
8.192
-0.052
-0.63%
jan 1, 2002
8.149
-0.043
-0.52%
jan 1, 2003
8.106
-0.043
-0.53%
jan 1, 2004
8.057
-0.049
-0.6%
jan 1, 2005
7.998
-0.059
-0.73%
jan 1, 2006
7.929
-0.069
-0.86%
jan 1, 2007
7.846
-0.083
-1.05%
jan 1, 2008
7.754
-0.092
-1.17%
jan 1, 2009
7.655
-0.099
-1.28%
jan 1, 2010
7.553
-0.102
-1.33%
jan 1, 2011
7.452
-0.101
-1.34%
jan 1, 2012
7.359
-0.093
-1.25%
jan 1, 2013
7.277
-0.082
-1.11%
jan 1, 2014
7.208
-0.069
-0.95%
jan 1, 2015
7.155
-0.053
-0.74%
Ranking of countries by current statistics by years


Comments: