29
/
en
AIzaSyAYiBZKx7MnpbEhh9jyipgxe19OcubqV5w
April 1, 2024
123310
Ecuador
ECU
true
2
1
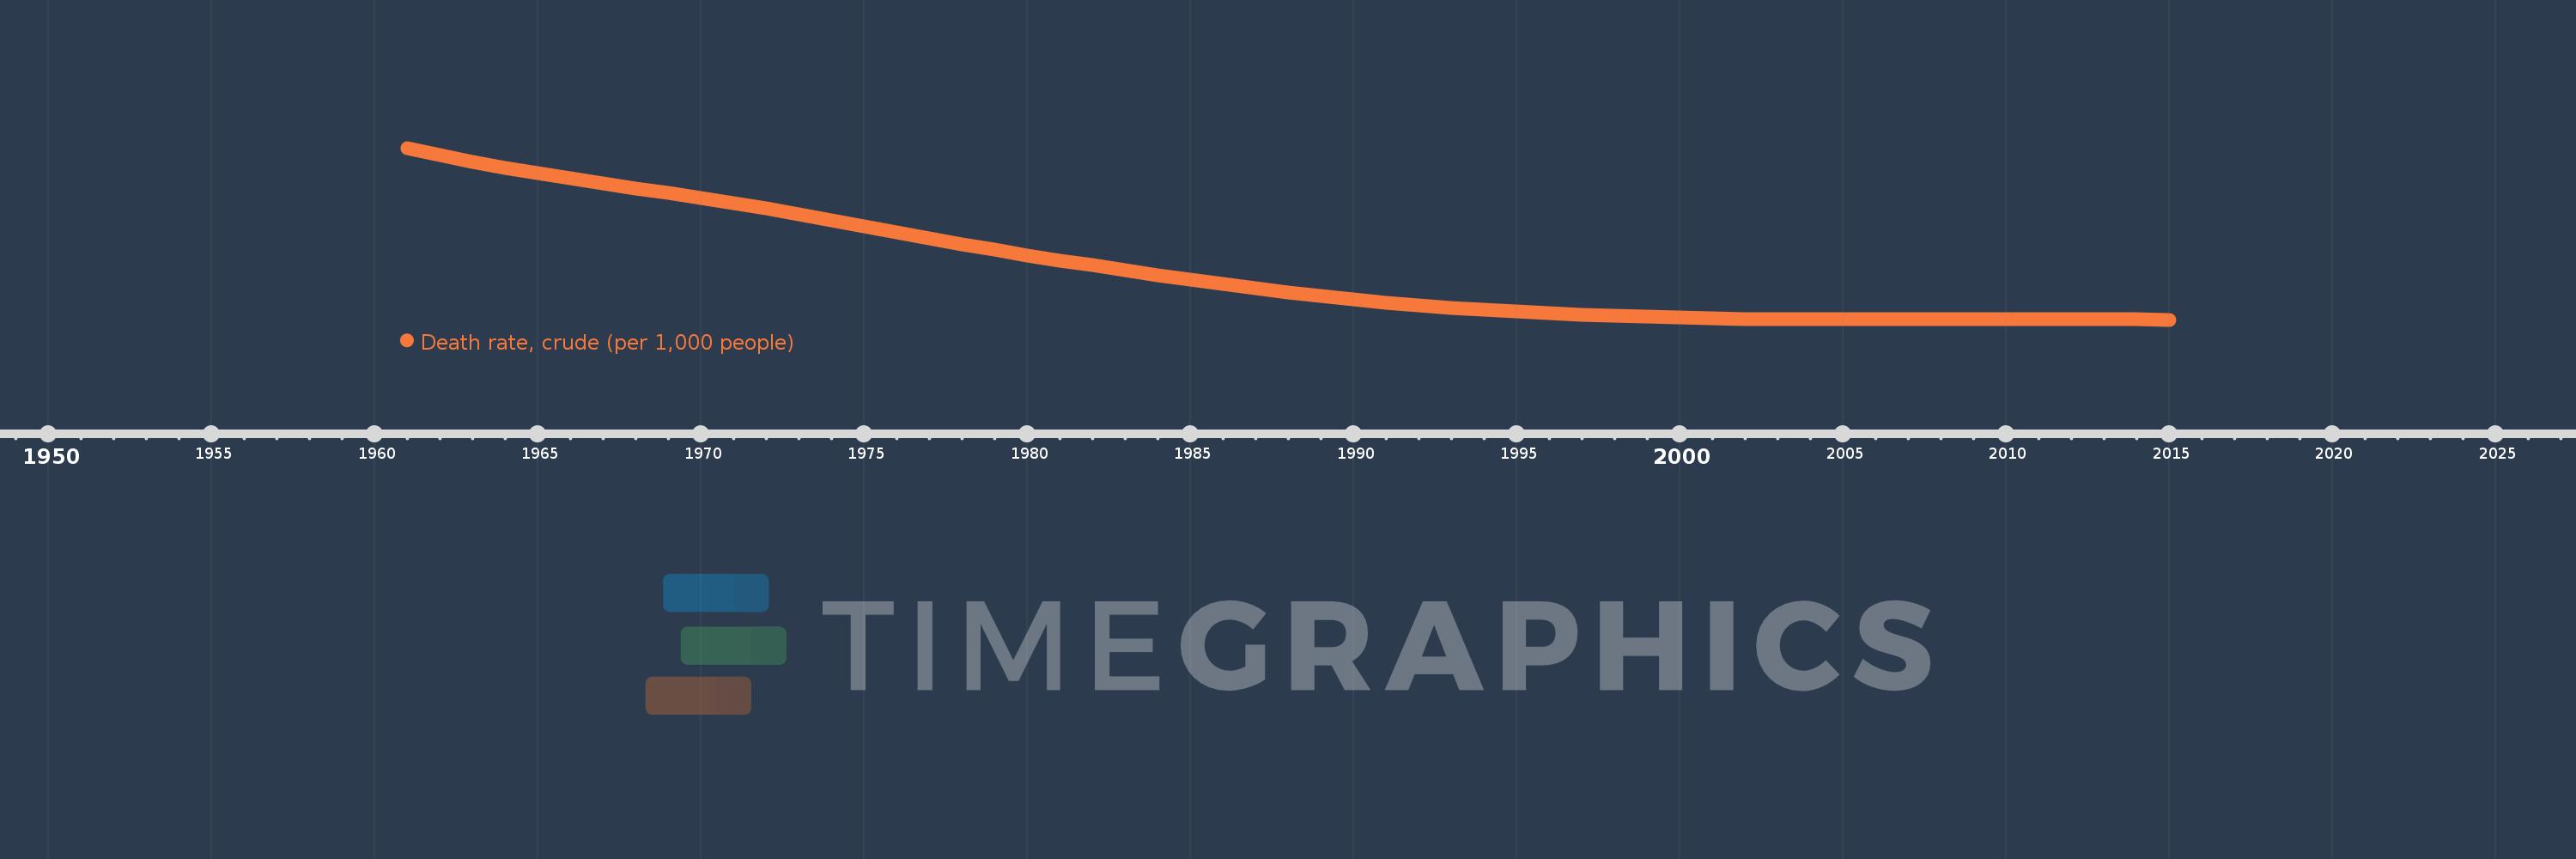
Death rate, crude (per 1,000 people)
2015,2014,2013,2012,2011,2010,2009,2008,2007,2006,2005,2004,2003,2002,2001,2000,1999,1998,1997,1996,1995,1994,1993,1992,1991,1990,1989,1988,1987,1986,1985,1984,1983,1982,1981,1980,1979,1978,1977,1976,1975,1974,1973,1972,1971,1970,1969,1968,1967,1966,1965,1964,1963,1962,1961
This statistics in other country:
AfghanistanAlbaniaAlgeriaAmerican SamoaAndorraAngolaAntigua and BarbudaArab WorldArgentinaArmeniaArubaAustraliaAustriaAzerbaijanBahamas, TheBahrainBangladeshBarbadosBelarusBelgiumBelizeBeninBermudaBhutanBoliviaBosnia and HerzegovinaBotswanaBrazilBrunei DarussalamBulgariaBurkina FasoBurundiCabo VerdeCambodiaCameroonCanadaCaribbean small statesCayman IslandsCentral African RepublicCentral Europe and the BalticsChadChannel IslandsChileChinaColombiaComorosCongo, Dem. Rep.Congo, Rep.Costa RicaCote d'IvoireCroatiaCubaCuracaoCyprusCzech RepublicDenmarkDjiboutiDominicaDominican RepublicEarly-demographic dividendEast Asia & PacificEast Asia & Pacific (excluding high income)East Asia & Pacific (IDA & IBRD countries)EcuadorEgypt, Arab Rep.El SalvadorEquatorial GuineaEritreaEstoniaEthiopiaEuro areaEurope & Central AsiaEurope & Central Asia (excluding high income)Europe & Central Asia (IDA & IBRD countries)European UnionFaroe IslandsFijiFinlandFragile and conflict affected situationsFranceFrench PolynesiaGabonGambia, TheGeorgiaGermanyGhanaGreeceGreenlandGrenadaGuamGuatemalaGuineaGuinea-BissauGuyanaHaitiHeavily indebted poor countries (HIPC)High incomeHondurasHong Kong SAR, ChinaHungaryIBRD onlyIcelandIDA & IBRD totalIDA blendIDA onlyIDA totalIndiaIndonesiaIran, Islamic Rep.IraqIrelandIsle of ManIsraelItalyJamaicaJapanJordanKazakhstanKenyaKiribatiKorea, Dem. People’s Rep.Korea, Rep.KosovoKuwaitKyrgyz RepublicLao PDRLate-demographic dividendLatin America & Caribbean Latin America & Caribbean (excluding high income)Latin America & the Caribbean (IDA & IBRD countries)LatviaLeast developed countries: UN classificationLebanonLesothoLiberiaLibyaLiechtensteinLithuaniaLow & middle incomeLow incomeLower middle incomeLuxembourgMacao SAR, ChinaMacedonia, FYRMadagascarMalawiMalaysiaMaldivesMaliMaltaMarshall IslandsMauritaniaMauritiusMexicoMicronesia, Fed. Sts.Middle East & North AfricaMiddle East & North Africa (excluding high income)Middle East & North Africa (IDA & IBRD countries)Middle incomeMoldovaMonacoMongoliaMontenegroMoroccoMozambiqueMyanmarNamibiaNepalNetherlandsNew CaledoniaNew ZealandNicaraguaNigerNigeriaNorth AmericaNorwayOECD membersOmanOther small statesPacific island small statesPakistanPalauPanamaPapua New GuineaParaguayPeruPhilippinesPolandPortugalPost-demographic dividendPre-demographic dividendPuerto RicoQatarRomaniaRussian FederationRwandaSamoaSan MarinoSao Tome and PrincipeSaudi ArabiaSenegalSerbiaSeychellesSierra LeoneSingaporeSint Maarten (Dutch part)Slovak RepublicSloveniaSmall statesSolomon IslandsSomaliaSouth AfricaSouth AsiaSouth Asia (IDA & IBRD)South SudanSpainSri LankaSt. Kitts and NevisSt. LuciaSt. Martin (French part)St. Vincent and the GrenadinesSub-Saharan Africa Sub-Saharan Africa (excluding high income)Sub-Saharan Africa (IDA & IBRD countries)SudanSurinameSwazilandSwedenSwitzerlandSyrian Arab RepublicTajikistanTanzaniaThailandTimor-LesteTogoTongaTrinidad and TobagoTunisiaTurkeyTurkmenistanUgandaUkraineUnited Arab EmiratesUnited KingdomUnited StatesUpper middle incomeUruguayUzbekistanVanuatuVenezuela, RBVietnamVirgin Islands (U.S.)West Bank and GazaWorldYemen, Rep.ZambiaZimbabwe Timeline:
This timeline shows a graph from 1961 to 2015 of Ecuador. No data until 1960. Number of actual observations by date: 55.
Source name:
World Development Indicators
Source organization:
(1) United Nations Population Division. World Population Prospects, (2) Census reports and other statistical publications from national statistical offices, (3) Eurostat: Demographic Statistics, (4) United Nations Statistical Division. Population and Vital Statistics Reprot (various years), (5) U.S. Census Bureau: International Database, and (6) Secretariat of the Pacific Community: Statistics and Demography Programme.
Categories, topics:
Health
Last updated:
apr 23, 2017
Indicators value changes by year
Maximum:
15.554
jan 1, 1961
At the date of observation
Value
Absolute change
Change from previous value
jan 1, 1961
15.554
+15.554
0.0%
jan 1, 1962
15.126
-0.428
-2.75%
jan 1, 1963
14.727
-0.399
-2.64%
jan 1, 1964
14.358
-0.369
-2.51%
jan 1, 1965
14.017
-0.341
-2.37%
jan 1, 1966
13.7
-0.317
-2.26%
jan 1, 1967
13.399
-0.301
-2.2%
jan 1, 1968
13.106
-0.293
-2.19%
jan 1, 1969
12.811
-0.295
-2.25%
jan 1, 1970
12.51
-0.301
-2.35%
jan 1, 1971
12.196
-0.314
-2.51%
jan 1, 1972
11.865
-0.331
-2.71%
jan 1, 1973
11.522
-0.343
-2.89%
jan 1, 1974
11.168
-0.354
-3.07%
jan 1, 1975
10.808
-0.36
-3.22%
jan 1, 1976
10.444
-0.364
-3.37%
jan 1, 1977
10.081
-0.363
-3.48%
jan 1, 1978
9.726
-0.355
-3.52%
jan 1, 1979
9.381
-0.345
-3.55%
jan 1, 1980
9.05
-0.331
-3.53%
jan 1, 1981
8.732
-0.318
-3.51%
jan 1, 1982
8.427
-0.305
-3.49%
jan 1, 1983
8.132
-0.295
-3.5%
jan 1, 1984
7.844
-0.288
-3.54%
jan 1, 1985
7.565
-0.279
-3.56%
jan 1, 1986
7.296
-0.269
-3.56%
jan 1, 1987
7.039
-0.257
-3.52%
jan 1, 1988
6.796
-0.243
-3.45%
jan 1, 1989
6.57
-0.226
-3.33%
jan 1, 1990
6.361
-0.209
-3.18%
jan 1, 1991
6.172
-0.189
-2.97%
jan 1, 1992
6.004
-0.168
-2.72%
jan 1, 1993
5.856
-0.148
-2.47%
jan 1, 1994
5.727
-0.129
-2.2%
jan 1, 1995
5.616
-0.111
-1.94%
jan 1, 1996
5.521
-0.095
-1.69%
jan 1, 1997
5.441
-0.08
-1.45%
jan 1, 1998
5.372
-0.069
-1.27%
jan 1, 1999
5.313
-0.059
-1.1%
jan 1, 2000
5.263
-0.05
-0.94%
jan 1, 2001
5.222
-0.041
-0.78%
jan 1, 2002
5.19
-0.032
-0.61%
jan 1, 2003
5.169
-0.021
-0.4%
jan 1, 2004
5.158
-0.011
-0.21%
jan 1, 2005
5.155
-0.003
-0.06%
jan 1, 2006
5.159
+0.004
0.08%
jan 1, 2007
5.165
+0.006
0.12%
jan 1, 2008
5.172
+0.007
0.14%
jan 1, 2009
5.177
+0.005
0.1%
jan 1, 2010
5.179
+0.002
0.04%
jan 1, 2011
5.176
-0.003
-0.06%
jan 1, 2012
5.168
-0.008
-0.15%
jan 1, 2013
5.157
-0.011
-0.21%
jan 1, 2014
5.145
-0.012
-0.23%
jan 1, 2015
5.131
-0.014
-0.27%
Ranking of countries by current statistics by years


Comments: