29
/
en
AIzaSyAYiBZKx7MnpbEhh9jyipgxe19OcubqV5w
April 1, 2024
68987
Antigua and Barbuda
ATG
true
2
1
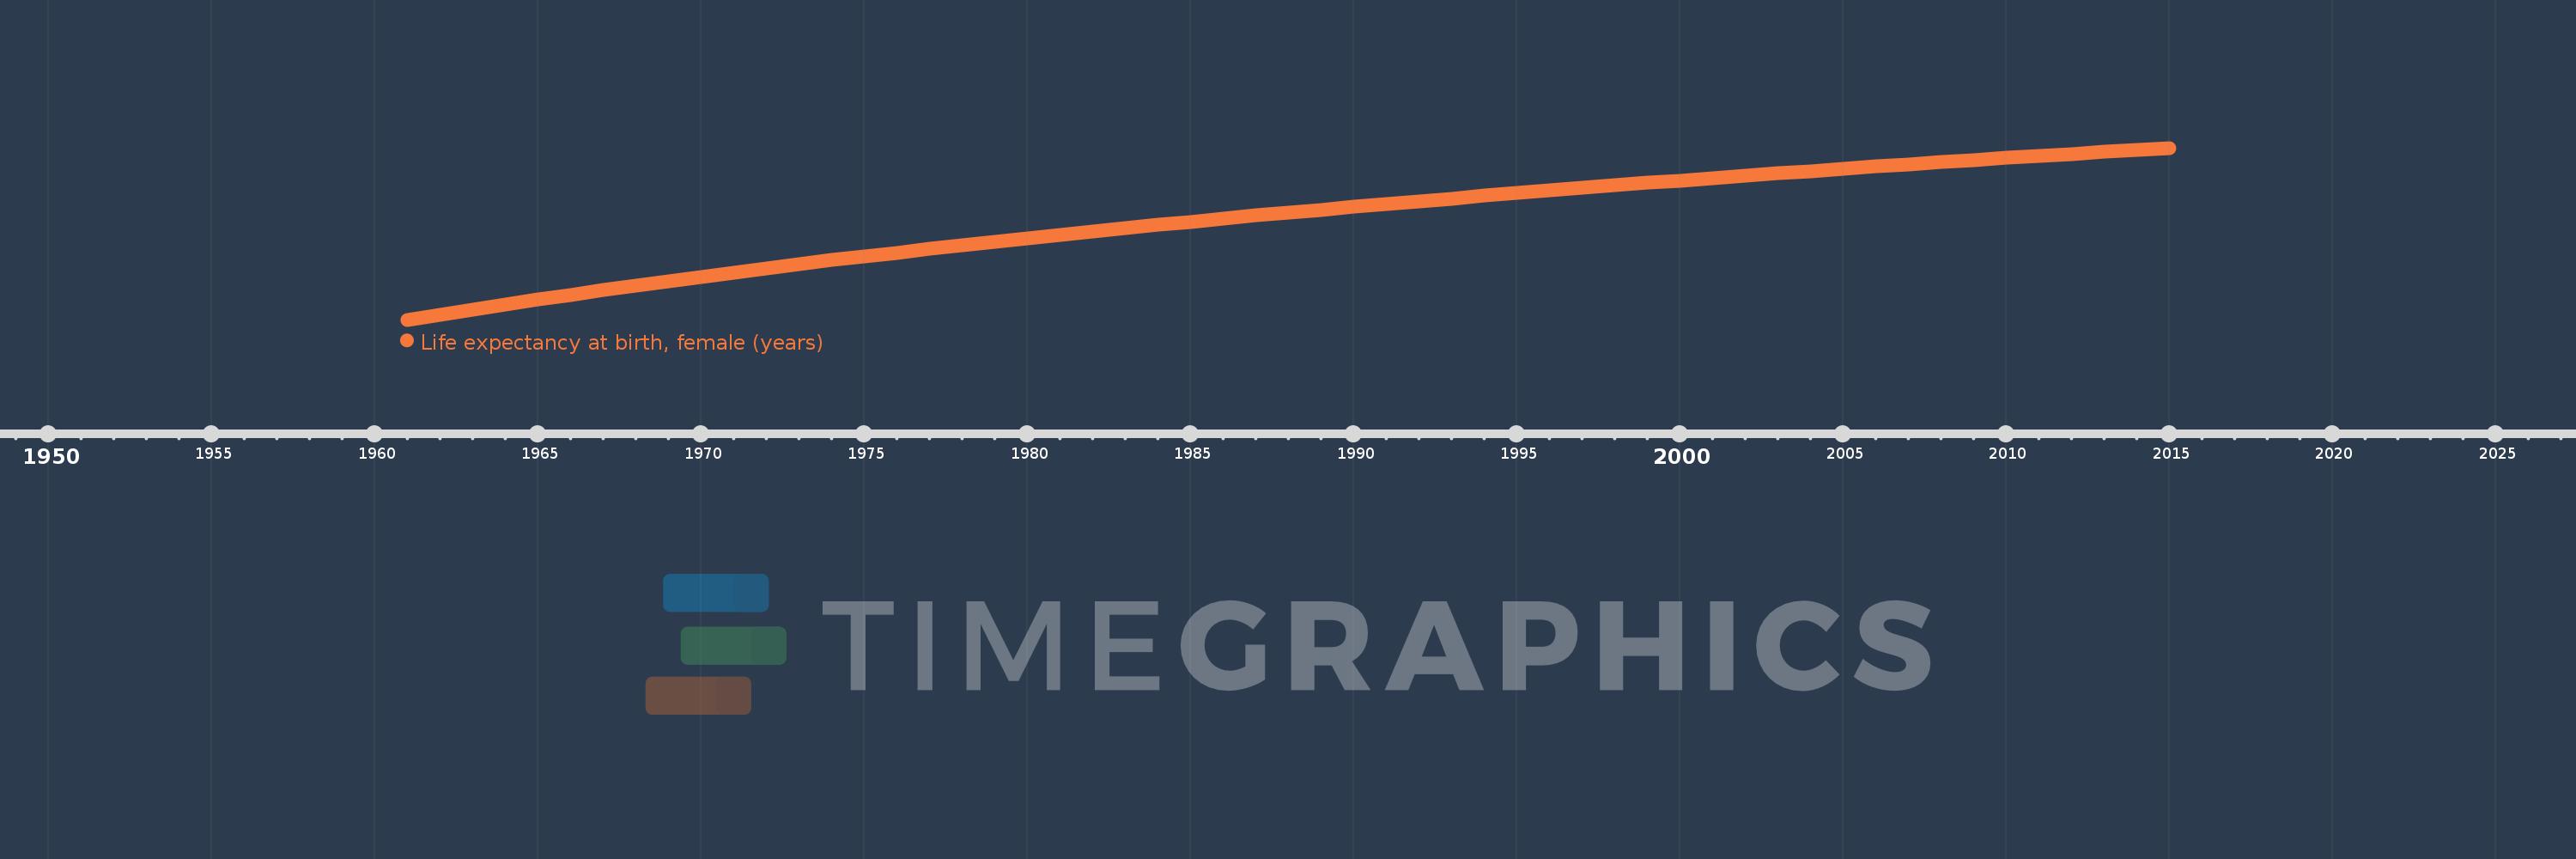
Life expectancy at birth, female (years)
2015,2014,2013,2012,2011,2010,2009,2008,2007,2006,2005,2004,2003,2002,2001,2000,1999,1998,1997,1996,1995,1994,1993,1992,1991,1990,1989,1988,1987,1986,1985,1984,1983,1982,1981,1980,1979,1978,1977,1976,1975,1974,1973,1972,1971,1970,1969,1968,1967,1966,1965,1964,1963,1962,1961
This statistics in other country:
AfghanistanAlbaniaAlgeriaAngolaAntigua and BarbudaArab WorldArgentinaArmeniaArubaAustraliaAustriaAzerbaijanBahamas, TheBahrainBangladeshBarbadosBelarusBelgiumBelizeBeninBermudaBhutanBoliviaBosnia and HerzegovinaBotswanaBrazilBrunei DarussalamBulgariaBurkina FasoBurundiCabo VerdeCambodiaCameroonCanadaCaribbean small statesCentral African RepublicCentral Europe and the BalticsChadChannel IslandsChileChinaColombiaComorosCongo, Dem. Rep.Congo, Rep.Costa RicaCote d'IvoireCroatiaCubaCuracaoCyprusCzech RepublicDenmarkDjiboutiDominicaDominican RepublicEarly-demographic dividendEast Asia & PacificEast Asia & Pacific (excluding high income)East Asia & Pacific (IDA & IBRD countries)EcuadorEgypt, Arab Rep.El SalvadorEquatorial GuineaEritreaEstoniaEthiopiaEuro areaEurope & Central AsiaEurope & Central Asia (excluding high income)Europe & Central Asia (IDA & IBRD countries)European UnionFaroe IslandsFijiFinlandFragile and conflict affected situationsFranceFrench PolynesiaGabonGambia, TheGeorgiaGermanyGhanaGreeceGreenlandGrenadaGuamGuatemalaGuineaGuinea-BissauGuyanaHaitiHeavily indebted poor countries (HIPC)High incomeHondurasHong Kong SAR, ChinaHungaryIBRD onlyIcelandIDA & IBRD totalIDA blendIDA onlyIDA totalIndiaIndonesiaIran, Islamic Rep.IraqIrelandIsle of ManIsraelItalyJamaicaJapanJordanKazakhstanKenyaKiribatiKorea, Dem. People’s Rep.Korea, Rep.KosovoKuwaitKyrgyz RepublicLao PDRLate-demographic dividendLatin America & Caribbean Latin America & Caribbean (excluding high income)Latin America & the Caribbean (IDA & IBRD countries)LatviaLeast developed countries: UN classificationLebanonLesothoLiberiaLibyaLiechtensteinLithuaniaLow & middle incomeLow incomeLower middle incomeLuxembourgMacao SAR, ChinaMacedonia, FYRMadagascarMalawiMalaysiaMaldivesMaliMaltaMarshall IslandsMauritaniaMauritiusMexicoMicronesia, Fed. Sts.Middle East & North AfricaMiddle East & North Africa (excluding high income)Middle East & North Africa (IDA & IBRD countries)Middle incomeMoldovaMongoliaMontenegroMoroccoMozambiqueMyanmarNamibiaNepalNetherlandsNew CaledoniaNew ZealandNicaraguaNigerNigeriaNorth AmericaNorwayOECD membersOmanOther small statesPacific island small statesPakistanPalauPanamaPapua New GuineaParaguayPeruPhilippinesPolandPortugalPost-demographic dividendPre-demographic dividendPuerto RicoQatarRomaniaRussian FederationRwandaSamoaSan MarinoSao Tome and PrincipeSaudi ArabiaSenegalSerbiaSeychellesSierra LeoneSingaporeSint Maarten (Dutch part)Slovak RepublicSloveniaSmall statesSolomon IslandsSomaliaSouth AfricaSouth AsiaSouth Asia (IDA & IBRD)South SudanSpainSri LankaSt. Kitts and NevisSt. LuciaSt. Martin (French part)St. Vincent and the GrenadinesSub-Saharan Africa Sub-Saharan Africa (excluding high income)Sub-Saharan Africa (IDA & IBRD countries)SudanSurinameSwazilandSwedenSwitzerlandSyrian Arab RepublicTajikistanTanzaniaThailandTimor-LesteTogoTongaTrinidad and TobagoTunisiaTurkeyTurkmenistanUgandaUkraineUnited Arab EmiratesUnited KingdomUnited StatesUpper middle incomeUruguayUzbekistanVanuatuVenezuela, RBVietnamVirgin Islands (U.S.)West Bank and GazaWorldYemen, Rep.ZambiaZimbabwe Timeline:
This timeline shows a graph from 1961 to 2015 of Antigua and Barbuda. No data until 1960. Number of actual observations by date: 55.
Source name:
World Development Indicators
Source organization:
(1) United Nations Population Division. World Population Prospects, (2) Census reports and other statistical publications from national statistical offices, (3) Eurostat: Demographic Statistics, (4) United Nations Statistical Division. Population and Vital Statistics Reprot (various years), (5) U.S. Census Bureau: International Database, and (6) Secretariat of the Pacific Community: Statistics and Demography Programme.
Categories, topics:
Health, Gender, Social Development
Last updated:
apr 23, 2017
Indicators value changes by year
Minimum:
64.167
jan 1, 1961
Maximum:
78.452
jan 1, 2015
At the date of observation
Value
Absolute change
Change from previous value
jan 1, 1961
64.167
+64.167
0.0%
jan 1, 1962
64.593
+0.426
0.66%
jan 1, 1963
65.012
+0.419
0.65%
jan 1, 1964
65.425
+0.413
0.64%
jan 1, 1965
65.832
+0.407
0.62%
jan 1, 1966
66.231
+0.399
0.61%
jan 1, 1967
66.622
+0.391
0.59%
jan 1, 1968
67.005
+0.383
0.57%
jan 1, 1969
67.378
+0.373
0.56%
jan 1, 1970
67.743
+0.365
0.54%
jan 1, 1971
68.098
+0.355
0.52%
jan 1, 1972
68.444
+0.346
0.51%
jan 1, 1973
68.781
+0.337
0.49%
jan 1, 1974
69.112
+0.331
0.48%
jan 1, 1975
69.435
+0.323
0.47%
jan 1, 1976
69.752
+0.317
0.46%
jan 1, 1977
70.063
+0.311
0.45%
jan 1, 1978
70.366
+0.303
0.43%
jan 1, 1979
70.663
+0.297
0.42%
jan 1, 1980
70.954
+0.291
0.41%
jan 1, 1981
71.239
+0.285
0.4%
jan 1, 1982
71.517
+0.278
0.39%
jan 1, 1983
71.79
+0.273
0.38%
jan 1, 1984
72.057
+0.267
0.37%
jan 1, 1985
72.318
+0.261
0.36%
jan 1, 1986
72.574
+0.256
0.35%
jan 1, 1987
72.826
+0.252
0.35%
jan 1, 1988
73.073
+0.247
0.34%
jan 1, 1989
73.316
+0.243
0.33%
jan 1, 1990
73.555
+0.239
0.33%
jan 1, 1991
73.79
+0.235
0.32%
jan 1, 1992
74.022
+0.232
0.31%
jan 1, 1993
74.251
+0.229
0.31%
jan 1, 1994
74.476
+0.225
0.3%
jan 1, 1995
74.697
+0.221
0.3%
jan 1, 1996
74.914
+0.217
0.29%
jan 1, 1997
75.128
+0.214
0.29%
jan 1, 1998
75.338
+0.21
0.28%
jan 1, 1999
75.545
+0.207
0.27%
jan 1, 2000
75.747
+0.202
0.27%
jan 1, 2001
75.947
+0.2
0.26%
jan 1, 2002
76.144
+0.197
0.26%
jan 1, 2003
76.338
+0.194
0.25%
jan 1, 2004
76.53
+0.192
0.25%
jan 1, 2005
76.719
+0.189
0.25%
jan 1, 2006
76.906
+0.187
0.24%
jan 1, 2007
77.09
+0.184
0.24%
jan 1, 2008
77.272
+0.182
0.24%
jan 1, 2009
77.45
+0.178
0.23%
jan 1, 2010
77.624
+0.174
0.22%
jan 1, 2011
77.796
+0.172
0.22%
jan 1, 2012
77.964
+0.168
0.22%
jan 1, 2013
78.129
+0.165
0.21%
jan 1, 2014
78.292
+0.163
0.21%
jan 1, 2015
78.452
+0.16
0.2%
Ranking of countries by current statistics by years


Comments: