29
/
en
AIzaSyAYiBZKx7MnpbEhh9jyipgxe19OcubqV5w
April 1, 2024
211934
Niger
NER
true
2
1
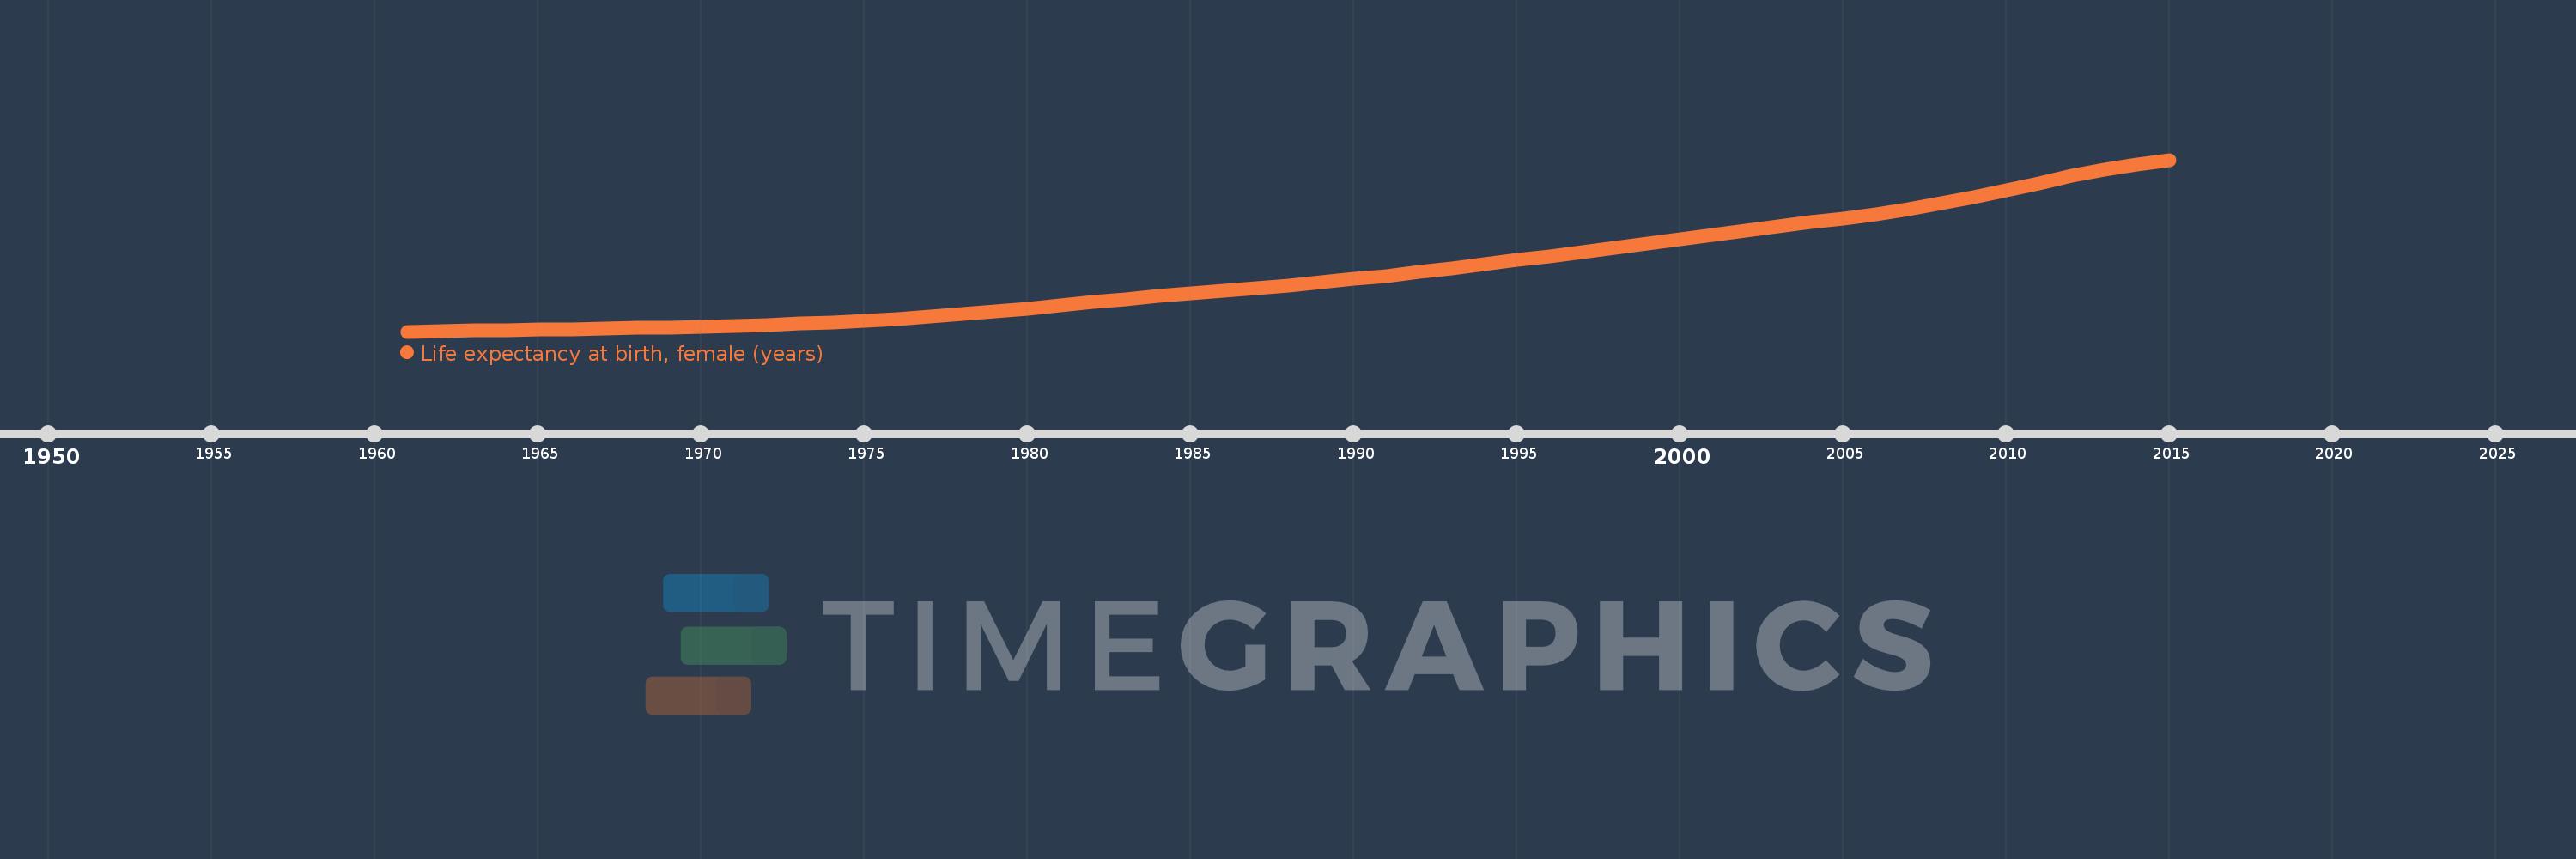
Life expectancy at birth, female (years)
2015,2014,2013,2012,2011,2010,2009,2008,2007,2006,2005,2004,2003,2002,2001,2000,1999,1998,1997,1996,1995,1994,1993,1992,1991,1990,1989,1988,1987,1986,1985,1984,1983,1982,1981,1980,1979,1978,1977,1976,1975,1974,1973,1972,1971,1970,1969,1968,1967,1966,1965,1964,1963,1962,1961
This statistics in other country:
AfghanistanAlbaniaAlgeriaAngolaAntigua and BarbudaArab WorldArgentinaArmeniaArubaAustraliaAustriaAzerbaijanBahamas, TheBahrainBangladeshBarbadosBelarusBelgiumBelizeBeninBermudaBhutanBoliviaBosnia and HerzegovinaBotswanaBrazilBrunei DarussalamBulgariaBurkina FasoBurundiCabo VerdeCambodiaCameroonCanadaCaribbean small statesCentral African RepublicCentral Europe and the BalticsChadChannel IslandsChileChinaColombiaComorosCongo, Dem. Rep.Congo, Rep.Costa RicaCote d'IvoireCroatiaCubaCuracaoCyprusCzech RepublicDenmarkDjiboutiDominicaDominican RepublicEarly-demographic dividendEast Asia & PacificEast Asia & Pacific (excluding high income)East Asia & Pacific (IDA & IBRD countries)EcuadorEgypt, Arab Rep.El SalvadorEquatorial GuineaEritreaEstoniaEthiopiaEuro areaEurope & Central AsiaEurope & Central Asia (excluding high income)Europe & Central Asia (IDA & IBRD countries)European UnionFaroe IslandsFijiFinlandFragile and conflict affected situationsFranceFrench PolynesiaGabonGambia, TheGeorgiaGermanyGhanaGreeceGreenlandGrenadaGuamGuatemalaGuineaGuinea-BissauGuyanaHaitiHeavily indebted poor countries (HIPC)High incomeHondurasHong Kong SAR, ChinaHungaryIBRD onlyIcelandIDA & IBRD totalIDA blendIDA onlyIDA totalIndiaIndonesiaIran, Islamic Rep.IraqIrelandIsle of ManIsraelItalyJamaicaJapanJordanKazakhstanKenyaKiribatiKorea, Dem. People’s Rep.Korea, Rep.KosovoKuwaitKyrgyz RepublicLao PDRLate-demographic dividendLatin America & Caribbean Latin America & Caribbean (excluding high income)Latin America & the Caribbean (IDA & IBRD countries)LatviaLeast developed countries: UN classificationLebanonLesothoLiberiaLibyaLiechtensteinLithuaniaLow & middle incomeLow incomeLower middle incomeLuxembourgMacao SAR, ChinaMacedonia, FYRMadagascarMalawiMalaysiaMaldivesMaliMaltaMarshall IslandsMauritaniaMauritiusMexicoMicronesia, Fed. Sts.Middle East & North AfricaMiddle East & North Africa (excluding high income)Middle East & North Africa (IDA & IBRD countries)Middle incomeMoldovaMongoliaMontenegroMoroccoMozambiqueMyanmarNamibiaNepalNetherlandsNew CaledoniaNew ZealandNicaraguaNigerNigeriaNorth AmericaNorwayOECD membersOmanOther small statesPacific island small statesPakistanPalauPanamaPapua New GuineaParaguayPeruPhilippinesPolandPortugalPost-demographic dividendPre-demographic dividendPuerto RicoQatarRomaniaRussian FederationRwandaSamoaSan MarinoSao Tome and PrincipeSaudi ArabiaSenegalSerbiaSeychellesSierra LeoneSingaporeSint Maarten (Dutch part)Slovak RepublicSloveniaSmall statesSolomon IslandsSomaliaSouth AfricaSouth AsiaSouth Asia (IDA & IBRD)South SudanSpainSri LankaSt. Kitts and NevisSt. LuciaSt. Martin (French part)St. Vincent and the GrenadinesSub-Saharan Africa Sub-Saharan Africa (excluding high income)Sub-Saharan Africa (IDA & IBRD countries)SudanSurinameSwazilandSwedenSwitzerlandSyrian Arab RepublicTajikistanTanzaniaThailandTimor-LesteTogoTongaTrinidad and TobagoTunisiaTurkeyTurkmenistanUgandaUkraineUnited Arab EmiratesUnited KingdomUnited StatesUpper middle incomeUruguayUzbekistanVanuatuVenezuela, RBVietnamVirgin Islands (U.S.)West Bank and GazaWorldYemen, Rep.ZambiaZimbabwe Timeline:
This timeline shows a graph from 1961 to 2015 of Niger. No data until 1960. Number of actual observations by date: 55.
Source name:
World Development Indicators
Source organization:
(1) United Nations Population Division. World Population Prospects, (2) Census reports and other statistical publications from national statistical offices, (3) Eurostat: Demographic Statistics, (4) United Nations Statistical Division. Population and Vital Statistics Reprot (various years), (5) U.S. Census Bureau: International Database, and (6) Secretariat of the Pacific Community: Statistics and Demography Programme.
Categories, topics:
Health, Gender, Social Development
Last updated:
apr 23, 2017
Indicators value changes by year
Minimum:
35.471
jan 1, 1961
Maximum:
62.383
jan 1, 2015
At the date of observation
Value
Absolute change
Change from previous value
jan 1, 1961
35.471
+35.471
0.0%
jan 1, 1962
35.562
+0.091
0.26%
jan 1, 1963
35.646
+0.084
0.24%
jan 1, 1964
35.724
+0.078
0.22%
jan 1, 1965
35.796
+0.072
0.2%
jan 1, 1966
35.865
+0.069
0.19%
jan 1, 1967
35.935
+0.07
0.2%
jan 1, 1968
36.013
+0.078
0.22%
jan 1, 1969
36.107
+0.094
0.26%
jan 1, 1970
36.22
+0.113
0.31%
jan 1, 1971
36.358
+0.138
0.38%
jan 1, 1972
36.521
+0.163
0.45%
jan 1, 1973
36.709
+0.188
0.51%
jan 1, 1974
36.925
+0.216
0.59%
jan 1, 1975
37.171
+0.246
0.67%
jan 1, 1976
37.456
+0.285
0.77%
jan 1, 1977
37.789
+0.333
0.89%
jan 1, 1978
38.173
+0.384
1.02%
jan 1, 1979
38.601
+0.428
1.12%
jan 1, 1980
39.068
+0.467
1.21%
jan 1, 1981
39.558
+0.49
1.25%
jan 1, 1982
40.052
+0.494
1.25%
jan 1, 1983
40.536
+0.484
1.21%
jan 1, 1984
41.0
+0.464
1.14%
jan 1, 1985
41.444
+0.444
1.08%
jan 1, 1986
41.871
+0.427
1.03%
jan 1, 1987
42.293
+0.422
1.01%
jan 1, 1988
42.728
+0.435
1.03%
jan 1, 1989
43.19
+0.462
1.08%
jan 1, 1990
43.685
+0.495
1.15%
jan 1, 1991
44.216
+0.531
1.22%
jan 1, 1992
44.785
+0.569
1.29%
jan 1, 1993
45.383
+0.598
1.34%
jan 1, 1994
46.004
+0.621
1.37%
jan 1, 1995
46.644
+0.64
1.39%
jan 1, 1996
47.297
+0.653
1.4%
jan 1, 1997
47.962
+0.665
1.41%
jan 1, 1998
48.634
+0.672
1.4%
jan 1, 1999
49.31
+0.676
1.39%
jan 1, 2000
49.988
+0.678
1.37%
jan 1, 2001
50.658
+0.67
1.34%
jan 1, 2002
51.308
+0.65
1.28%
jan 1, 2003
51.942
+0.634
1.24%
jan 1, 2004
52.568
+0.626
1.21%
jan 1, 2005
53.201
+0.633
1.2%
jan 1, 2006
53.88
+0.679
1.28%
jan 1, 2007
54.652
+0.772
1.43%
jan 1, 2008
55.538
+0.886
1.62%
jan 1, 2009
56.535
+0.997
1.8%
jan 1, 2010
57.62
+1.085
1.92%
jan 1, 2011
58.742
+1.122
1.95%
jan 1, 2012
59.832
+1.09
1.86%
jan 1, 2013
60.827
+0.995
1.66%
jan 1, 2014
61.683
+0.856
1.41%
jan 1, 2015
62.383
+0.7
1.13%
Ranking of countries by current statistics by years


Comments: