29
/
en
AIzaSyAYiBZKx7MnpbEhh9jyipgxe19OcubqV5w
April 1, 2024
40053
IDA total
IDA
false
2
1
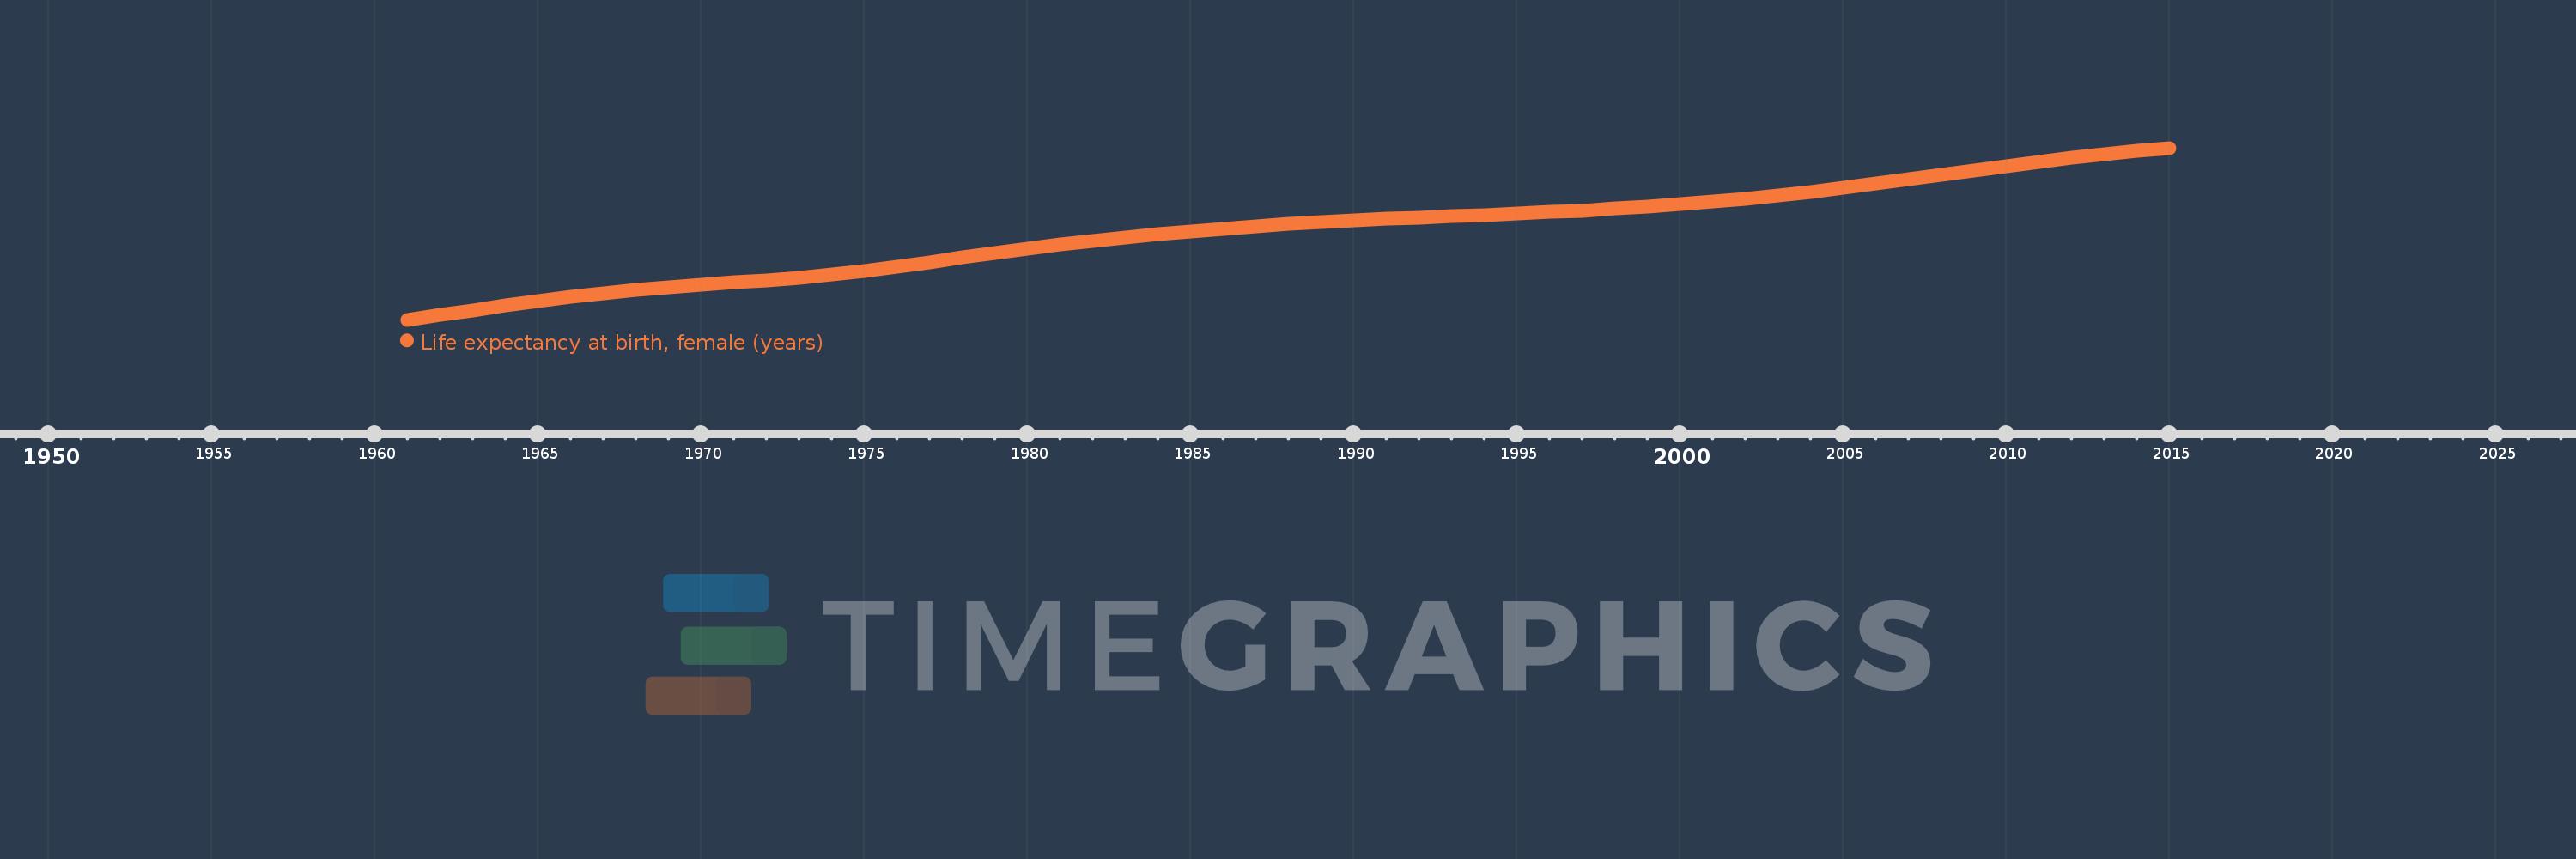
Life expectancy at birth, female (years)
2015,2014,2013,2012,2011,2010,2009,2008,2007,2006,2005,2004,2003,2002,2001,2000,1999,1998,1997,1996,1995,1994,1993,1992,1991,1990,1989,1988,1987,1986,1985,1984,1983,1982,1981,1980,1979,1978,1977,1976,1975,1974,1973,1972,1971,1970,1969,1968,1967,1966,1965,1964,1963,1962,1961
This statistics in other country:
AfghanistanAlbaniaAlgeriaAngolaAntigua and BarbudaArab WorldArgentinaArmeniaArubaAustraliaAustriaAzerbaijanBahamas, TheBahrainBangladeshBarbadosBelarusBelgiumBelizeBeninBermudaBhutanBoliviaBosnia and HerzegovinaBotswanaBrazilBrunei DarussalamBulgariaBurkina FasoBurundiCabo VerdeCambodiaCameroonCanadaCaribbean small statesCentral African RepublicCentral Europe and the BalticsChadChannel IslandsChileChinaColombiaComorosCongo, Dem. Rep.Congo, Rep.Costa RicaCote d'IvoireCroatiaCubaCuracaoCyprusCzech RepublicDenmarkDjiboutiDominicaDominican RepublicEarly-demographic dividendEast Asia & PacificEast Asia & Pacific (excluding high income)East Asia & Pacific (IDA & IBRD countries)EcuadorEgypt, Arab Rep.El SalvadorEquatorial GuineaEritreaEstoniaEthiopiaEuro areaEurope & Central AsiaEurope & Central Asia (excluding high income)Europe & Central Asia (IDA & IBRD countries)European UnionFaroe IslandsFijiFinlandFragile and conflict affected situationsFranceFrench PolynesiaGabonGambia, TheGeorgiaGermanyGhanaGreeceGreenlandGrenadaGuamGuatemalaGuineaGuinea-BissauGuyanaHaitiHeavily indebted poor countries (HIPC)High incomeHondurasHong Kong SAR, ChinaHungaryIBRD onlyIcelandIDA & IBRD totalIDA blendIDA onlyIDA totalIndiaIndonesiaIran, Islamic Rep.IraqIrelandIsle of ManIsraelItalyJamaicaJapanJordanKazakhstanKenyaKiribatiKorea, Dem. People’s Rep.Korea, Rep.KosovoKuwaitKyrgyz RepublicLao PDRLate-demographic dividendLatin America & Caribbean Latin America & Caribbean (excluding high income)Latin America & the Caribbean (IDA & IBRD countries)LatviaLeast developed countries: UN classificationLebanonLesothoLiberiaLibyaLiechtensteinLithuaniaLow & middle incomeLow incomeLower middle incomeLuxembourgMacao SAR, ChinaMacedonia, FYRMadagascarMalawiMalaysiaMaldivesMaliMaltaMarshall IslandsMauritaniaMauritiusMexicoMicronesia, Fed. Sts.Middle East & North AfricaMiddle East & North Africa (excluding high income)Middle East & North Africa (IDA & IBRD countries)Middle incomeMoldovaMongoliaMontenegroMoroccoMozambiqueMyanmarNamibiaNepalNetherlandsNew CaledoniaNew ZealandNicaraguaNigerNigeriaNorth AmericaNorwayOECD membersOmanOther small statesPacific island small statesPakistanPalauPanamaPapua New GuineaParaguayPeruPhilippinesPolandPortugalPost-demographic dividendPre-demographic dividendPuerto RicoQatarRomaniaRussian FederationRwandaSamoaSan MarinoSao Tome and PrincipeSaudi ArabiaSenegalSerbiaSeychellesSierra LeoneSingaporeSint Maarten (Dutch part)Slovak RepublicSloveniaSmall statesSolomon IslandsSomaliaSouth AfricaSouth AsiaSouth Asia (IDA & IBRD)South SudanSpainSri LankaSt. Kitts and NevisSt. LuciaSt. Martin (French part)St. Vincent and the GrenadinesSub-Saharan Africa Sub-Saharan Africa (excluding high income)Sub-Saharan Africa (IDA & IBRD countries)SudanSurinameSwazilandSwedenSwitzerlandSyrian Arab RepublicTajikistanTanzaniaThailandTimor-LesteTogoTongaTrinidad and TobagoTunisiaTurkeyTurkmenistanUgandaUkraineUnited Arab EmiratesUnited KingdomUnited StatesUpper middle incomeUruguayUzbekistanVanuatuVenezuela, RBVietnamVirgin Islands (U.S.)West Bank and GazaWorldYemen, Rep.ZambiaZimbabwe Timeline:
This timeline shows a graph from 1961 to 2015 of IDA total. No data until 1960. Number of actual observations by date: 55.
Source name:
World Development Indicators
Source organization:
(1) United Nations Population Division. World Population Prospects, (2) Census reports and other statistical publications from national statistical offices, (3) Eurostat: Demographic Statistics, (4) United Nations Statistical Division. Population and Vital Statistics Reprot (various years), (5) U.S. Census Bureau: International Database, and (6) Secretariat of the Pacific Community: Statistics and Demography Programme.
Categories, topics:
Health, Gender, Social Development
Last updated:
apr 23, 2017
Indicators value changes by year
Maximum:
65.104
jan 1, 2015
At the date of observation
Value
Absolute change
Change from previous value
jan 1, 1961
45.18
+45.18
0.0%
jan 1, 1962
45.727
+0.547
1.21%
jan 1, 1963
46.272
+0.545
1.19%
jan 1, 1964
46.807
+0.535
1.16%
jan 1, 1965
47.337
+0.53
1.13%
jan 1, 1966
47.834
+0.497
1.05%
jan 1, 1967
48.279
+0.445
0.93%
jan 1, 1968
48.66
+0.381
0.79%
jan 1, 1969
48.979
+0.32
0.66%
jan 1, 1970
49.247
+0.268
0.55%
jan 1, 1971
49.49
+0.243
0.49%
jan 1, 1972
49.742
+0.252
0.51%
jan 1, 1973
50.035
+0.294
0.59%
jan 1, 1974
50.392
+0.357
0.71%
jan 1, 1975
50.814
+0.422
0.84%
jan 1, 1976
51.298
+0.484
0.95%
jan 1, 1977
51.83
+0.532
1.04%
jan 1, 1978
52.378
+0.548
1.06%
jan 1, 1979
52.915
+0.537
1.02%
jan 1, 1980
53.422
+0.507
0.96%
jan 1, 1981
53.888
+0.467
0.87%
jan 1, 1982
54.308
+0.42
0.78%
jan 1, 1983
54.7
+0.392
0.72%
jan 1, 1984
55.069
+0.369
0.67%
jan 1, 1985
55.416
+0.347
0.63%
jan 1, 1986
55.736
+0.321
0.58%
jan 1, 1987
56.027
+0.29
0.52%
jan 1, 1988
56.283
+0.256
0.46%
jan 1, 1989
56.504
+0.221
0.39%
jan 1, 1990
56.705
+0.201
0.36%
jan 1, 1991
56.875
+0.17
0.3%
jan 1, 1992
57.031
+0.156
0.27%
jan 1, 1993
57.183
+0.152
0.27%
jan 1, 1994
57.338
+0.154
0.27%
jan 1, 1995
57.494
+0.156
0.27%
jan 1, 1996
57.662
+0.168
0.29%
jan 1, 1997
57.849
+0.187
0.32%
jan 1, 1998
58.055
+0.206
0.36%
jan 1, 1999
58.285
+0.23
0.4%
jan 1, 2000
58.552
+0.267
0.46%
jan 1, 2001
58.848
+0.297
0.51%
jan 1, 2002
59.191
+0.343
0.58%
jan 1, 2003
59.575
+0.383
0.65%
jan 1, 2004
60.003
+0.428
0.72%
jan 1, 2005
60.468
+0.465
0.78%
jan 1, 2006
60.962
+0.494
0.82%
jan 1, 2007
61.479
+0.517
0.85%
jan 1, 2008
62.005
+0.526
0.86%
jan 1, 2009
62.526
+0.521
0.84%
jan 1, 2010
63.031
+0.505
0.81%
jan 1, 2011
63.518
+0.487
0.77%
jan 1, 2012
63.951
+0.433
0.68%
jan 1, 2013
64.363
+0.411
0.64%
jan 1, 2014
64.746
+0.383
0.6%
jan 1, 2015
65.104
+0.358
0.55%
Ranking of countries by current statistics by years


Comments: