29
/
en
AIzaSyAYiBZKx7MnpbEhh9jyipgxe19OcubqV5w
April 1, 2024
171898
Kuwait
KWT
true
2
1
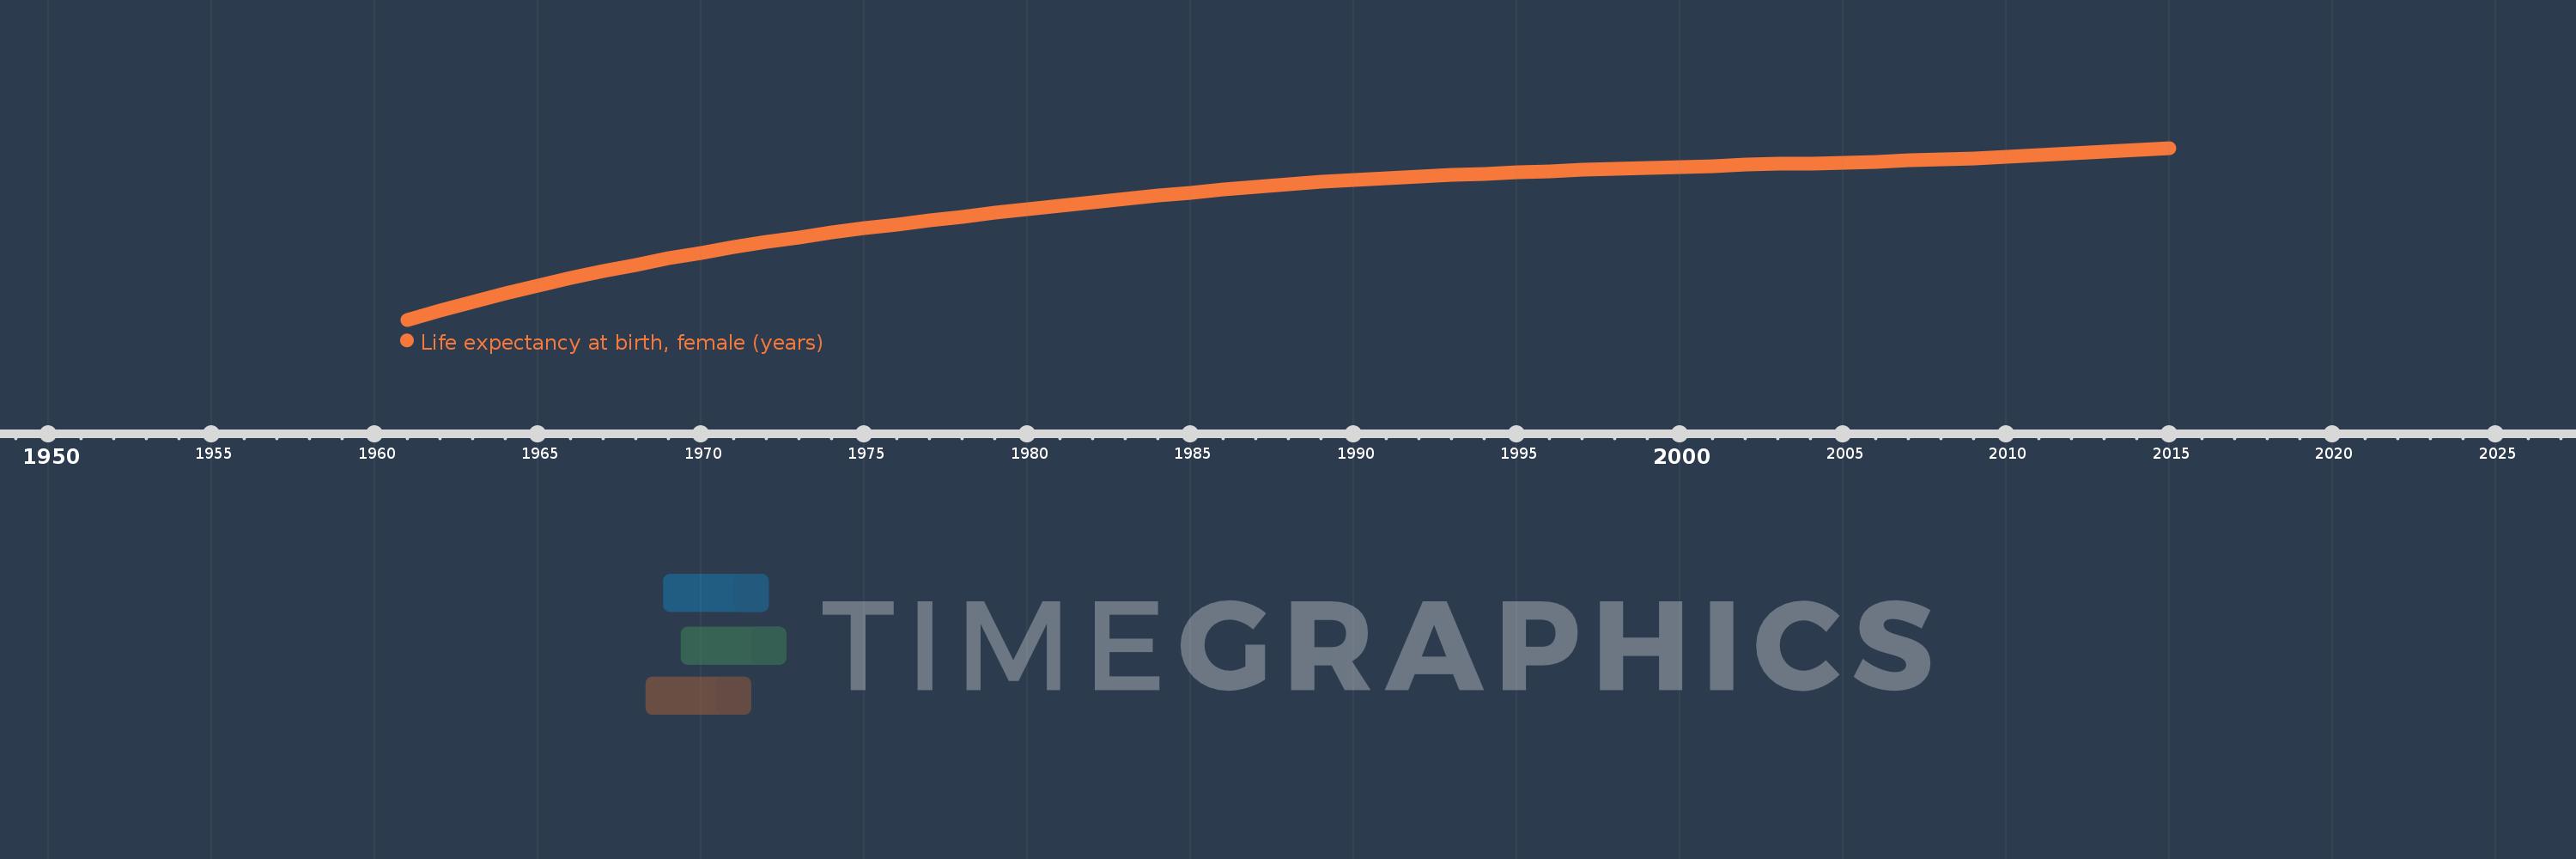
Life expectancy at birth, female (years)
2015,2014,2013,2012,2011,2010,2009,2008,2007,2006,2005,2004,2003,2002,2001,2000,1999,1998,1997,1996,1995,1994,1993,1992,1991,1990,1989,1988,1987,1986,1985,1984,1983,1982,1981,1980,1979,1978,1977,1976,1975,1974,1973,1972,1971,1970,1969,1968,1967,1966,1965,1964,1963,1962,1961
This statistics in other country:
AfghanistanAlbaniaAlgeriaAngolaAntigua and BarbudaArab WorldArgentinaArmeniaArubaAustraliaAustriaAzerbaijanBahamas, TheBahrainBangladeshBarbadosBelarusBelgiumBelizeBeninBermudaBhutanBoliviaBosnia and HerzegovinaBotswanaBrazilBrunei DarussalamBulgariaBurkina FasoBurundiCabo VerdeCambodiaCameroonCanadaCaribbean small statesCentral African RepublicCentral Europe and the BalticsChadChannel IslandsChileChinaColombiaComorosCongo, Dem. Rep.Congo, Rep.Costa RicaCote d'IvoireCroatiaCubaCuracaoCyprusCzech RepublicDenmarkDjiboutiDominicaDominican RepublicEarly-demographic dividendEast Asia & PacificEast Asia & Pacific (excluding high income)East Asia & Pacific (IDA & IBRD countries)EcuadorEgypt, Arab Rep.El SalvadorEquatorial GuineaEritreaEstoniaEthiopiaEuro areaEurope & Central AsiaEurope & Central Asia (excluding high income)Europe & Central Asia (IDA & IBRD countries)European UnionFaroe IslandsFijiFinlandFragile and conflict affected situationsFranceFrench PolynesiaGabonGambia, TheGeorgiaGermanyGhanaGreeceGreenlandGrenadaGuamGuatemalaGuineaGuinea-BissauGuyanaHaitiHeavily indebted poor countries (HIPC)High incomeHondurasHong Kong SAR, ChinaHungaryIBRD onlyIcelandIDA & IBRD totalIDA blendIDA onlyIDA totalIndiaIndonesiaIran, Islamic Rep.IraqIrelandIsle of ManIsraelItalyJamaicaJapanJordanKazakhstanKenyaKiribatiKorea, Dem. People’s Rep.Korea, Rep.KosovoKuwaitKyrgyz RepublicLao PDRLate-demographic dividendLatin America & Caribbean Latin America & Caribbean (excluding high income)Latin America & the Caribbean (IDA & IBRD countries)LatviaLeast developed countries: UN classificationLebanonLesothoLiberiaLibyaLiechtensteinLithuaniaLow & middle incomeLow incomeLower middle incomeLuxembourgMacao SAR, ChinaMacedonia, FYRMadagascarMalawiMalaysiaMaldivesMaliMaltaMarshall IslandsMauritaniaMauritiusMexicoMicronesia, Fed. Sts.Middle East & North AfricaMiddle East & North Africa (excluding high income)Middle East & North Africa (IDA & IBRD countries)Middle incomeMoldovaMongoliaMontenegroMoroccoMozambiqueMyanmarNamibiaNepalNetherlandsNew CaledoniaNew ZealandNicaraguaNigerNigeriaNorth AmericaNorwayOECD membersOmanOther small statesPacific island small statesPakistanPalauPanamaPapua New GuineaParaguayPeruPhilippinesPolandPortugalPost-demographic dividendPre-demographic dividendPuerto RicoQatarRomaniaRussian FederationRwandaSamoaSan MarinoSao Tome and PrincipeSaudi ArabiaSenegalSerbiaSeychellesSierra LeoneSingaporeSint Maarten (Dutch part)Slovak RepublicSloveniaSmall statesSolomon IslandsSomaliaSouth AfricaSouth AsiaSouth Asia (IDA & IBRD)South SudanSpainSri LankaSt. Kitts and NevisSt. LuciaSt. Martin (French part)St. Vincent and the GrenadinesSub-Saharan Africa Sub-Saharan Africa (excluding high income)Sub-Saharan Africa (IDA & IBRD countries)SudanSurinameSwazilandSwedenSwitzerlandSyrian Arab RepublicTajikistanTanzaniaThailandTimor-LesteTogoTongaTrinidad and TobagoTunisiaTurkeyTurkmenistanUgandaUkraineUnited Arab EmiratesUnited KingdomUnited StatesUpper middle incomeUruguayUzbekistanVanuatuVenezuela, RBVietnamVirgin Islands (U.S.)West Bank and GazaWorldYemen, Rep.ZambiaZimbabwe Timeline:
This timeline shows a graph from 1961 to 2015 of Kuwait. No data until 1960. Number of actual observations by date: 55.
Source name:
World Development Indicators
Source organization:
(1) United Nations Population Division. World Population Prospects, (2) Census reports and other statistical publications from national statistical offices, (3) Eurostat: Demographic Statistics, (4) United Nations Statistical Division. Population and Vital Statistics Reprot (various years), (5) U.S. Census Bureau: International Database, and (6) Secretariat of the Pacific Community: Statistics and Demography Programme.
Categories, topics:
Health, Gender, Social Development
Last updated:
apr 23, 2017
Indicators value changes by year
Minimum:
61.631
jan 1, 1961
At the date of observation
Value
Absolute change
Change from previous value
jan 1, 1961
61.631
+61.631
0.0%
jan 1, 1962
62.39
+0.759
1.23%
jan 1, 1963
63.109
+0.719
1.15%
jan 1, 1964
63.789
+0.68
1.08%
jan 1, 1965
64.431
+0.642
1.01%
jan 1, 1966
65.038
+0.607
0.94%
jan 1, 1967
65.611
+0.573
0.88%
jan 1, 1968
66.151
+0.54
0.82%
jan 1, 1969
66.662
+0.511
0.77%
jan 1, 1970
67.145
+0.483
0.72%
jan 1, 1971
67.601
+0.456
0.68%
jan 1, 1972
68.028
+0.427
0.63%
jan 1, 1973
68.427
+0.399
0.59%
jan 1, 1974
68.8
+0.373
0.55%
jan 1, 1975
69.15
+0.35
0.51%
jan 1, 1976
69.482
+0.332
0.48%
jan 1, 1977
69.8
+0.318
0.46%
jan 1, 1978
70.11
+0.31
0.44%
jan 1, 1979
70.412
+0.302
0.43%
jan 1, 1980
70.71
+0.298
0.42%
jan 1, 1981
71.004
+0.294
0.42%
jan 1, 1982
71.293
+0.289
0.41%
jan 1, 1983
71.574
+0.281
0.39%
jan 1, 1984
71.843
+0.269
0.38%
jan 1, 1985
72.099
+0.256
0.36%
jan 1, 1986
72.339
+0.24
0.33%
jan 1, 1987
72.561
+0.222
0.31%
jan 1, 1988
72.765
+0.204
0.28%
jan 1, 1989
72.949
+0.184
0.25%
jan 1, 1990
73.116
+0.167
0.23%
jan 1, 1991
73.266
+0.15
0.21%
jan 1, 1992
73.402
+0.136
0.19%
jan 1, 1993
73.525
+0.123
0.17%
jan 1, 1994
73.64
+0.115
0.16%
jan 1, 1995
73.748
+0.108
0.15%
jan 1, 1996
73.85
+0.102
0.14%
jan 1, 1997
73.948
+0.098
0.13%
jan 1, 1998
74.04
+0.092
0.12%
jan 1, 1999
74.127
+0.087
0.12%
jan 1, 2000
74.211
+0.084
0.11%
jan 1, 2001
74.29
+0.079
0.11%
jan 1, 2002
74.365
+0.075
0.1%
jan 1, 2003
74.435
+0.07
0.09%
jan 1, 2004
74.502
+0.067
0.09%
jan 1, 2005
74.57
+0.068
0.09%
jan 1, 2006
74.642
+0.072
0.1%
jan 1, 2007
74.723
+0.081
0.11%
jan 1, 2008
74.818
+0.095
0.13%
jan 1, 2009
74.926
+0.108
0.14%
jan 1, 2010
75.048
+0.122
0.16%
jan 1, 2011
75.182
+0.134
0.18%
jan 1, 2012
75.325
+0.143
0.19%
jan 1, 2013
75.471
+0.146
0.19%
jan 1, 2014
75.617
+0.146
0.19%
jan 1, 2015
75.76
+0.143
0.19%
Ranking of countries by current statistics by years


Comments: