29
/
en
AIzaSyAYiBZKx7MnpbEhh9jyipgxe19OcubqV5w
April 1, 2024
253241
Sudan
SDN
true
2
1
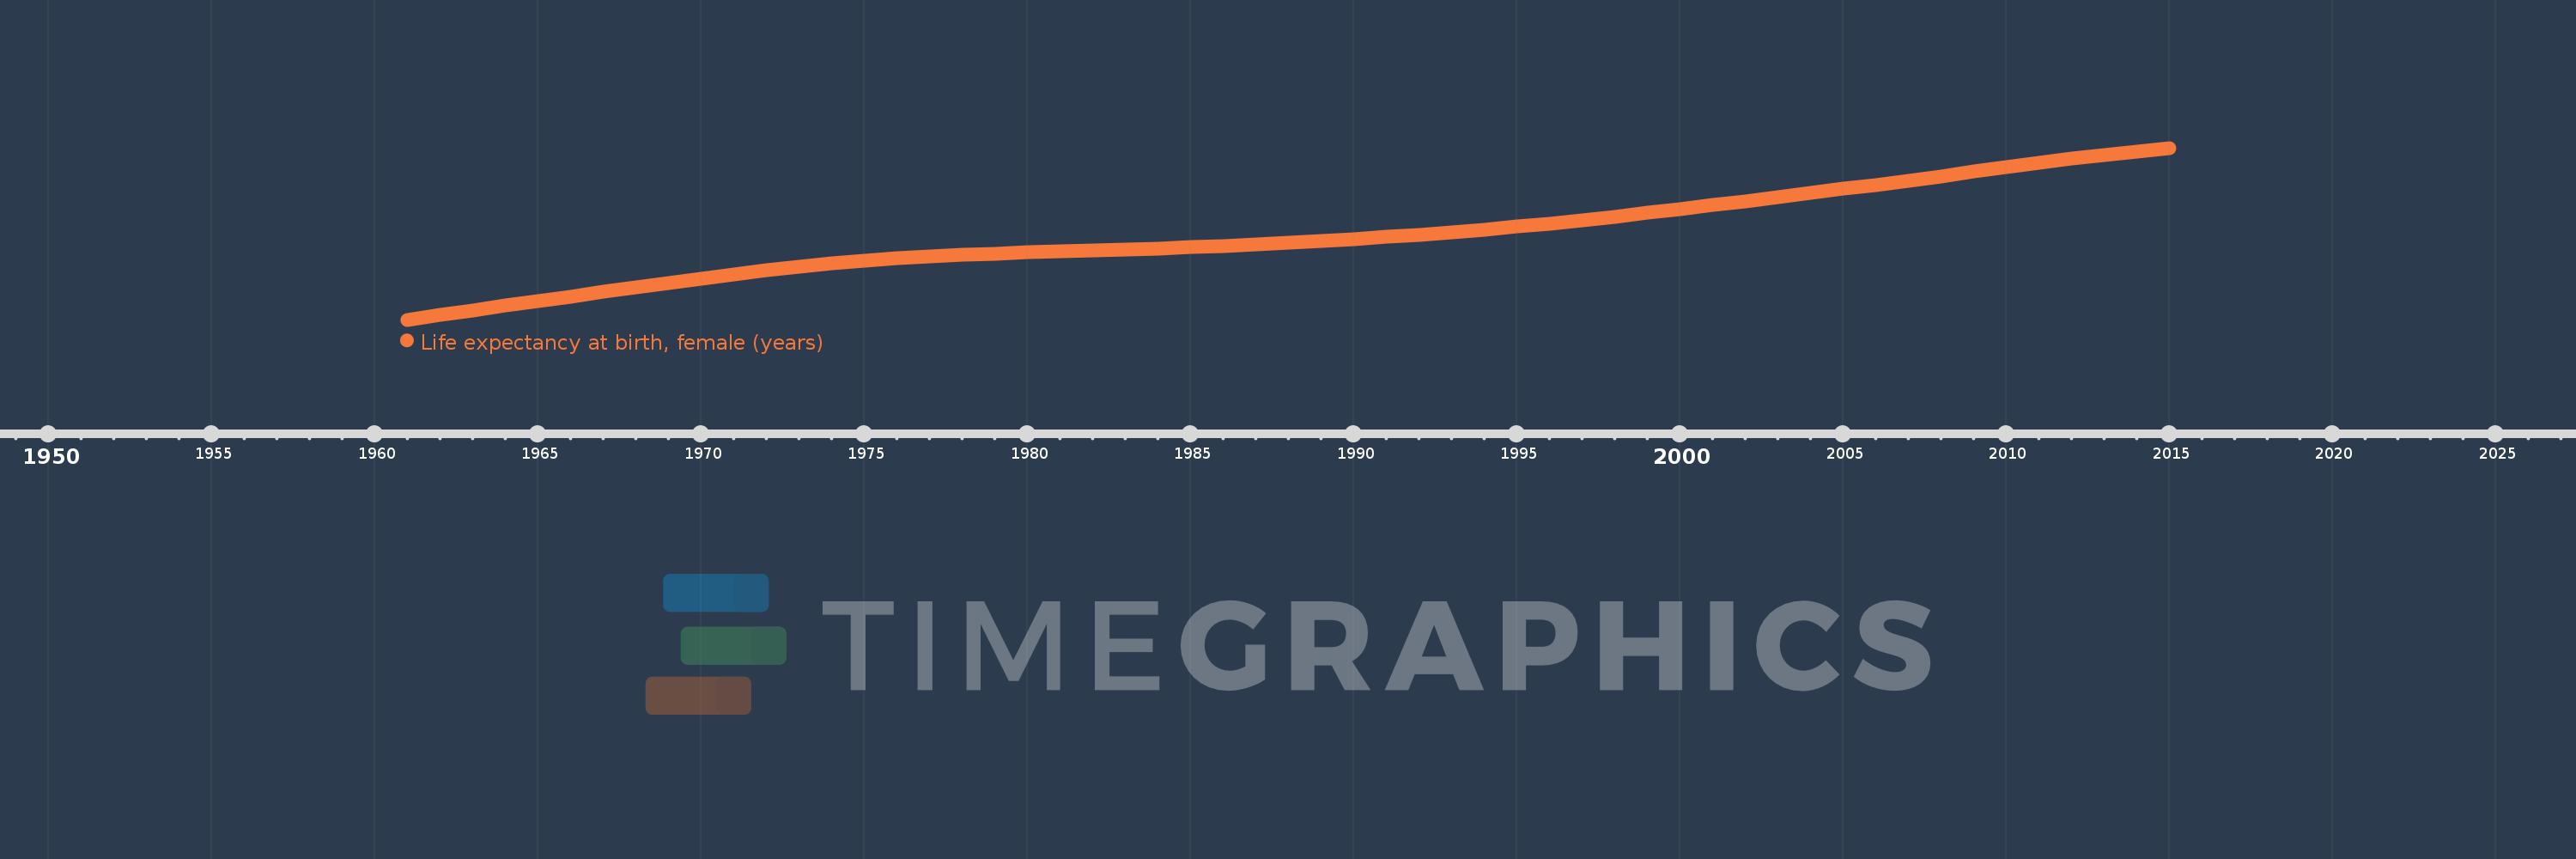
Life expectancy at birth, female (years)
2015,2014,2013,2012,2011,2010,2009,2008,2007,2006,2005,2004,2003,2002,2001,2000,1999,1998,1997,1996,1995,1994,1993,1992,1991,1990,1989,1988,1987,1986,1985,1984,1983,1982,1981,1980,1979,1978,1977,1976,1975,1974,1973,1972,1971,1970,1969,1968,1967,1966,1965,1964,1963,1962,1961
This statistics in other country:
AfghanistanAlbaniaAlgeriaAngolaAntigua and BarbudaArab WorldArgentinaArmeniaArubaAustraliaAustriaAzerbaijanBahamas, TheBahrainBangladeshBarbadosBelarusBelgiumBelizeBeninBermudaBhutanBoliviaBosnia and HerzegovinaBotswanaBrazilBrunei DarussalamBulgariaBurkina FasoBurundiCabo VerdeCambodiaCameroonCanadaCaribbean small statesCentral African RepublicCentral Europe and the BalticsChadChannel IslandsChileChinaColombiaComorosCongo, Dem. Rep.Congo, Rep.Costa RicaCote d'IvoireCroatiaCubaCuracaoCyprusCzech RepublicDenmarkDjiboutiDominicaDominican RepublicEarly-demographic dividendEast Asia & PacificEast Asia & Pacific (excluding high income)East Asia & Pacific (IDA & IBRD countries)EcuadorEgypt, Arab Rep.El SalvadorEquatorial GuineaEritreaEstoniaEthiopiaEuro areaEurope & Central AsiaEurope & Central Asia (excluding high income)Europe & Central Asia (IDA & IBRD countries)European UnionFaroe IslandsFijiFinlandFragile and conflict affected situationsFranceFrench PolynesiaGabonGambia, TheGeorgiaGermanyGhanaGreeceGreenlandGrenadaGuamGuatemalaGuineaGuinea-BissauGuyanaHaitiHeavily indebted poor countries (HIPC)High incomeHondurasHong Kong SAR, ChinaHungaryIBRD onlyIcelandIDA & IBRD totalIDA blendIDA onlyIDA totalIndiaIndonesiaIran, Islamic Rep.IraqIrelandIsle of ManIsraelItalyJamaicaJapanJordanKazakhstanKenyaKiribatiKorea, Dem. People’s Rep.Korea, Rep.KosovoKuwaitKyrgyz RepublicLao PDRLate-demographic dividendLatin America & Caribbean Latin America & Caribbean (excluding high income)Latin America & the Caribbean (IDA & IBRD countries)LatviaLeast developed countries: UN classificationLebanonLesothoLiberiaLibyaLiechtensteinLithuaniaLow & middle incomeLow incomeLower middle incomeLuxembourgMacao SAR, ChinaMacedonia, FYRMadagascarMalawiMalaysiaMaldivesMaliMaltaMarshall IslandsMauritaniaMauritiusMexicoMicronesia, Fed. Sts.Middle East & North AfricaMiddle East & North Africa (excluding high income)Middle East & North Africa (IDA & IBRD countries)Middle incomeMoldovaMongoliaMontenegroMoroccoMozambiqueMyanmarNamibiaNepalNetherlandsNew CaledoniaNew ZealandNicaraguaNigerNigeriaNorth AmericaNorwayOECD membersOmanOther small statesPacific island small statesPakistanPalauPanamaPapua New GuineaParaguayPeruPhilippinesPolandPortugalPost-demographic dividendPre-demographic dividendPuerto RicoQatarRomaniaRussian FederationRwandaSamoaSan MarinoSao Tome and PrincipeSaudi ArabiaSenegalSerbiaSeychellesSierra LeoneSingaporeSint Maarten (Dutch part)Slovak RepublicSloveniaSmall statesSolomon IslandsSomaliaSouth AfricaSouth AsiaSouth Asia (IDA & IBRD)South SudanSpainSri LankaSt. Kitts and NevisSt. LuciaSt. Martin (French part)St. Vincent and the GrenadinesSub-Saharan Africa Sub-Saharan Africa (excluding high income)Sub-Saharan Africa (IDA & IBRD countries)SudanSurinameSwazilandSwedenSwitzerlandSyrian Arab RepublicTajikistanTanzaniaThailandTimor-LesteTogoTongaTrinidad and TobagoTunisiaTurkeyTurkmenistanUgandaUkraineUnited Arab EmiratesUnited KingdomUnited StatesUpper middle incomeUruguayUzbekistanVanuatuVenezuela, RBVietnamVirgin Islands (U.S.)West Bank and GazaWorldYemen, Rep.ZambiaZimbabwe Timeline:
This timeline shows a graph from 1961 to 2015 of Sudan. No data until 1960. Number of actual observations by date: 55.
Source name:
World Development Indicators
Source organization:
(1) United Nations Population Division. World Population Prospects, (2) Census reports and other statistical publications from national statistical offices, (3) Eurostat: Demographic Statistics, (4) United Nations Statistical Division. Population and Vital Statistics Reprot (various years), (5) U.S. Census Bureau: International Database, and (6) Secretariat of the Pacific Community: Statistics and Demography Programme.
Categories, topics:
Health, Gender, Social Development
Last updated:
apr 23, 2017
Indicators value changes by year
Minimum:
49.652
jan 1, 1961
Maximum:
65.011
jan 1, 2015
At the date of observation
Value
Absolute change
Change from previous value
jan 1, 1961
49.652
+49.652
0.0%
jan 1, 1962
50.08
+0.428
0.86%
jan 1, 1963
50.499
+0.419
0.84%
jan 1, 1964
50.911
+0.412
0.82%
jan 1, 1965
51.319
+0.408
0.8%
jan 1, 1966
51.724
+0.405
0.79%
jan 1, 1967
52.129
+0.405
0.78%
jan 1, 1968
52.534
+0.405
0.78%
jan 1, 1969
52.935
+0.401
0.76%
jan 1, 1970
53.327
+0.392
0.74%
jan 1, 1971
53.703
+0.376
0.71%
jan 1, 1972
54.055
+0.352
0.66%
jan 1, 1973
54.377
+0.322
0.6%
jan 1, 1974
54.664
+0.287
0.53%
jan 1, 1975
54.915
+0.251
0.46%
jan 1, 1976
55.126
+0.211
0.38%
jan 1, 1977
55.3
+0.174
0.32%
jan 1, 1978
55.441
+0.141
0.25%
jan 1, 1979
55.558
+0.117
0.21%
jan 1, 1980
55.658
+0.1
0.18%
jan 1, 1981
55.748
+0.09
0.16%
jan 1, 1982
55.836
+0.088
0.16%
jan 1, 1983
55.925
+0.089
0.16%
jan 1, 1984
56.021
+0.096
0.17%
jan 1, 1985
56.129
+0.108
0.19%
jan 1, 1986
56.251
+0.122
0.22%
jan 1, 1987
56.387
+0.136
0.24%
jan 1, 1988
56.536
+0.149
0.26%
jan 1, 1989
56.694
+0.158
0.28%
jan 1, 1990
56.864
+0.17
0.3%
jan 1, 1991
57.049
+0.185
0.33%
jan 1, 1992
57.251
+0.202
0.35%
jan 1, 1993
57.472
+0.221
0.39%
jan 1, 1994
57.712
+0.24
0.42%
jan 1, 1995
57.972
+0.26
0.45%
jan 1, 1996
58.252
+0.28
0.48%
jan 1, 1997
58.552
+0.3
0.52%
jan 1, 1998
58.867
+0.315
0.54%
jan 1, 1999
59.197
+0.33
0.56%
jan 1, 2000
59.537
+0.34
0.57%
jan 1, 2001
59.887
+0.35
0.59%
jan 1, 2002
60.243
+0.356
0.59%
jan 1, 2003
60.605
+0.362
0.6%
jan 1, 2004
60.972
+0.367
0.61%
jan 1, 2005
61.343
+0.371
0.61%
jan 1, 2006
61.717
+0.374
0.61%
jan 1, 2007
62.1
+0.383
0.62%
jan 1, 2008
62.491
+0.391
0.63%
jan 1, 2009
62.889
+0.398
0.64%
jan 1, 2010
63.287
+0.398
0.63%
jan 1, 2011
63.677
+0.39
0.62%
jan 1, 2012
64.05
+0.373
0.59%
jan 1, 2013
64.399
+0.349
0.54%
jan 1, 2014
64.719
+0.32
0.5%
jan 1, 2015
65.011
+0.292
0.45%
Ranking of countries by current statistics by years


Comments: