29
/
en
AIzaSyAYiBZKx7MnpbEhh9jyipgxe19OcubqV5w
April 1, 2024
62747
World
WLD
false
2
1
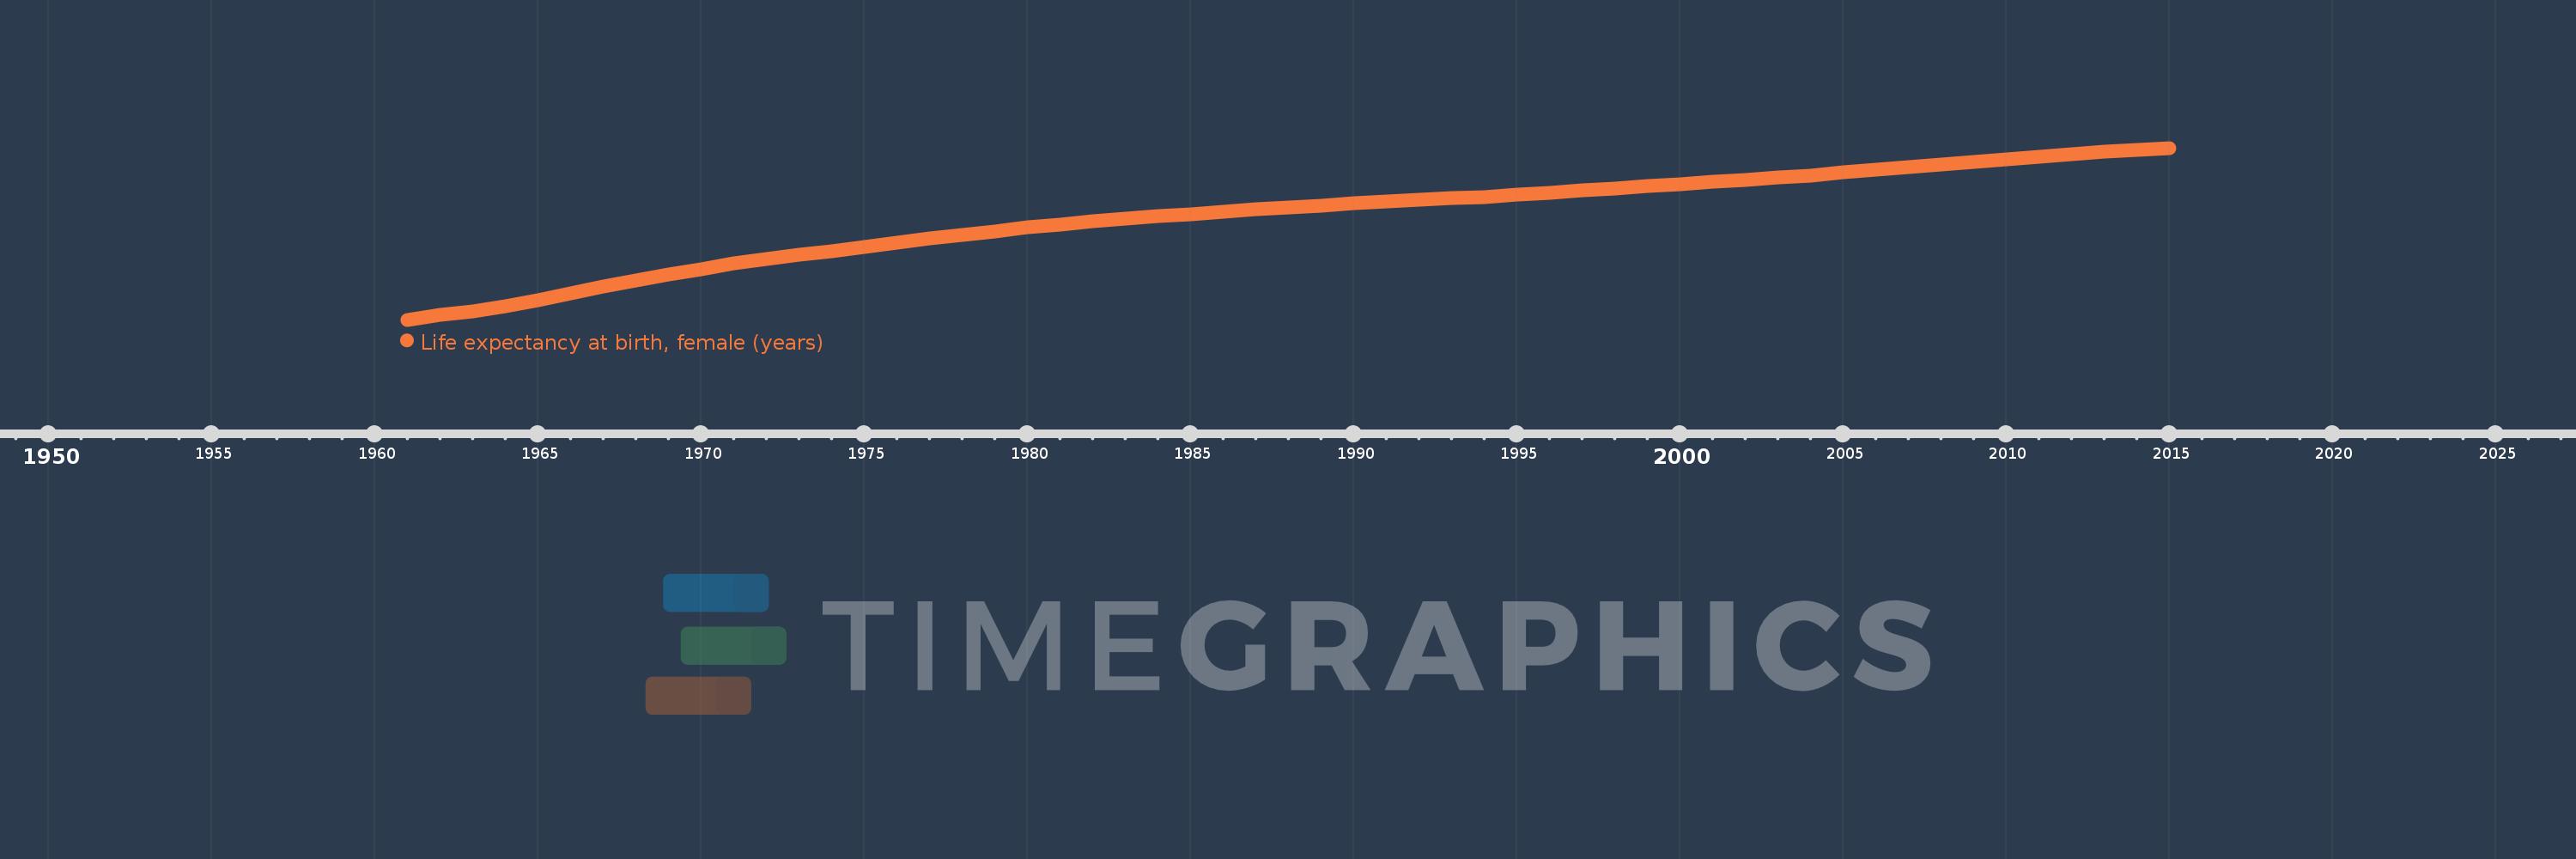
Life expectancy at birth, female (years)
2015,2014,2013,2012,2011,2010,2009,2008,2007,2006,2005,2004,2003,2002,2001,2000,1999,1998,1997,1996,1995,1994,1993,1992,1991,1990,1989,1988,1987,1986,1985,1984,1983,1982,1981,1980,1979,1978,1977,1976,1975,1974,1973,1972,1971,1970,1969,1968,1967,1966,1965,1964,1963,1962,1961
This statistics in other country:
AfghanistanAlbaniaAlgeriaAngolaAntigua and BarbudaArab WorldArgentinaArmeniaArubaAustraliaAustriaAzerbaijanBahamas, TheBahrainBangladeshBarbadosBelarusBelgiumBelizeBeninBermudaBhutanBoliviaBosnia and HerzegovinaBotswanaBrazilBrunei DarussalamBulgariaBurkina FasoBurundiCabo VerdeCambodiaCameroonCanadaCaribbean small statesCentral African RepublicCentral Europe and the BalticsChadChannel IslandsChileChinaColombiaComorosCongo, Dem. Rep.Congo, Rep.Costa RicaCote d'IvoireCroatiaCubaCuracaoCyprusCzech RepublicDenmarkDjiboutiDominicaDominican RepublicEarly-demographic dividendEast Asia & PacificEast Asia & Pacific (excluding high income)East Asia & Pacific (IDA & IBRD countries)EcuadorEgypt, Arab Rep.El SalvadorEquatorial GuineaEritreaEstoniaEthiopiaEuro areaEurope & Central AsiaEurope & Central Asia (excluding high income)Europe & Central Asia (IDA & IBRD countries)European UnionFaroe IslandsFijiFinlandFragile and conflict affected situationsFranceFrench PolynesiaGabonGambia, TheGeorgiaGermanyGhanaGreeceGreenlandGrenadaGuamGuatemalaGuineaGuinea-BissauGuyanaHaitiHeavily indebted poor countries (HIPC)High incomeHondurasHong Kong SAR, ChinaHungaryIBRD onlyIcelandIDA & IBRD totalIDA blendIDA onlyIDA totalIndiaIndonesiaIran, Islamic Rep.IraqIrelandIsle of ManIsraelItalyJamaicaJapanJordanKazakhstanKenyaKiribatiKorea, Dem. People’s Rep.Korea, Rep.KosovoKuwaitKyrgyz RepublicLao PDRLate-demographic dividendLatin America & Caribbean Latin America & Caribbean (excluding high income)Latin America & the Caribbean (IDA & IBRD countries)LatviaLeast developed countries: UN classificationLebanonLesothoLiberiaLibyaLiechtensteinLithuaniaLow & middle incomeLow incomeLower middle incomeLuxembourgMacao SAR, ChinaMacedonia, FYRMadagascarMalawiMalaysiaMaldivesMaliMaltaMarshall IslandsMauritaniaMauritiusMexicoMicronesia, Fed. Sts.Middle East & North AfricaMiddle East & North Africa (excluding high income)Middle East & North Africa (IDA & IBRD countries)Middle incomeMoldovaMongoliaMontenegroMoroccoMozambiqueMyanmarNamibiaNepalNetherlandsNew CaledoniaNew ZealandNicaraguaNigerNigeriaNorth AmericaNorwayOECD membersOmanOther small statesPacific island small statesPakistanPalauPanamaPapua New GuineaParaguayPeruPhilippinesPolandPortugalPost-demographic dividendPre-demographic dividendPuerto RicoQatarRomaniaRussian FederationRwandaSamoaSan MarinoSao Tome and PrincipeSaudi ArabiaSenegalSerbiaSeychellesSierra LeoneSingaporeSint Maarten (Dutch part)Slovak RepublicSloveniaSmall statesSolomon IslandsSomaliaSouth AfricaSouth AsiaSouth Asia (IDA & IBRD)South SudanSpainSri LankaSt. Kitts and NevisSt. LuciaSt. Martin (French part)St. Vincent and the GrenadinesSub-Saharan Africa Sub-Saharan Africa (excluding high income)Sub-Saharan Africa (IDA & IBRD countries)SudanSurinameSwazilandSwedenSwitzerlandSyrian Arab RepublicTajikistanTanzaniaThailandTimor-LesteTogoTongaTrinidad and TobagoTunisiaTurkeyTurkmenistanUgandaUkraineUnited Arab EmiratesUnited KingdomUnited StatesUpper middle incomeUruguayUzbekistanVanuatuVenezuela, RBVietnamVirgin Islands (U.S.)West Bank and GazaWorldYemen, Rep.ZambiaZimbabwe Timeline:
This timeline shows a graph from 1961 to 2015 of World. No data until 1960. Number of actual observations by date: 55.
Source name:
World Development Indicators
Source organization:
(1) United Nations Population Division. World Population Prospects, (2) Census reports and other statistical publications from national statistical offices, (3) Eurostat: Demographic Statistics, (4) United Nations Statistical Division. Population and Vital Statistics Reprot (various years), (5) U.S. Census Bureau: International Database, and (6) Secretariat of the Pacific Community: Statistics and Demography Programme.
Categories, topics:
Health, Gender, Social Development
Last updated:
apr 23, 2017
Indicators value changes by year
Maximum:
73.601
jan 1, 2015
At the date of observation
Value
Absolute change
Change from previous value
jan 1, 1961
54.42
+54.42
0.0%
jan 1, 1962
54.932
+0.512
0.94%
jan 1, 1963
55.365
+0.433
0.79%
jan 1, 1964
55.921
+0.556
1.0%
jan 1, 1965
56.628
+0.707
1.26%
jan 1, 1966
57.322
+0.694
1.23%
jan 1, 1967
58.094
+0.772
1.35%
jan 1, 1968
58.832
+0.738
1.27%
jan 1, 1969
59.476
+0.644
1.09%
jan 1, 1970
60.084
+0.608
1.02%
jan 1, 1971
60.681
+0.597
0.99%
jan 1, 1972
61.202
+0.521
0.86%
jan 1, 1973
61.663
+0.461
0.75%
jan 1, 1974
62.093
+0.43
0.7%
jan 1, 1975
62.581
+0.488
0.79%
jan 1, 1976
63.031
+0.449
0.72%
jan 1, 1977
63.46
+0.43
0.68%
jan 1, 1978
63.919
+0.458
0.72%
jan 1, 1979
64.306
+0.388
0.61%
jan 1, 1980
64.707
+0.401
0.62%
jan 1, 1981
65.017
+0.309
0.48%
jan 1, 1982
65.383
+0.366
0.56%
jan 1, 1983
65.718
+0.335
0.51%
jan 1, 1984
65.969
+0.251
0.38%
jan 1, 1985
66.235
+0.267
0.4%
jan 1, 1986
66.47
+0.235
0.35%
jan 1, 1987
66.743
+0.272
0.41%
jan 1, 1988
66.986
+0.244
0.37%
jan 1, 1989
67.191
+0.205
0.31%
jan 1, 1990
67.419
+0.228
0.34%
jan 1, 1991
67.631
+0.212
0.31%
jan 1, 1992
67.826
+0.194
0.29%
jan 1, 1993
67.988
+0.163
0.24%
jan 1, 1994
68.143
+0.155
0.23%
jan 1, 1995
68.386
+0.243
0.36%
jan 1, 1996
68.595
+0.209
0.31%
jan 1, 1997
68.845
+0.249
0.36%
jan 1, 1998
69.106
+0.261
0.38%
jan 1, 1999
69.313
+0.207
0.3%
jan 1, 2000
69.537
+0.224
0.32%
jan 1, 2001
69.784
+0.246
0.35%
jan 1, 2002
70.062
+0.278
0.4%
jan 1, 2003
70.302
+0.24
0.34%
jan 1, 2004
70.546
+0.244
0.35%
jan 1, 2005
70.872
+0.326
0.46%
jan 1, 2006
71.134
+0.262
0.37%
jan 1, 2007
71.458
+0.324
0.46%
jan 1, 2008
71.765
+0.307
0.43%
jan 1, 2009
72.042
+0.277
0.39%
jan 1, 2010
72.352
+0.31
0.43%
jan 1, 2011
72.623
+0.271
0.37%
jan 1, 2012
72.911
+0.288
0.4%
jan 1, 2013
73.148
+0.236
0.32%
jan 1, 2014
73.389
+0.241
0.33%
jan 1, 2015
73.601
+0.212
0.29%
Ranking of countries by current statistics by years


Comments: