29
/
en
AIzaSyAYiBZKx7MnpbEhh9jyipgxe19OcubqV5w
April 1, 2024
96340
Burundi
BDI
true
2
1
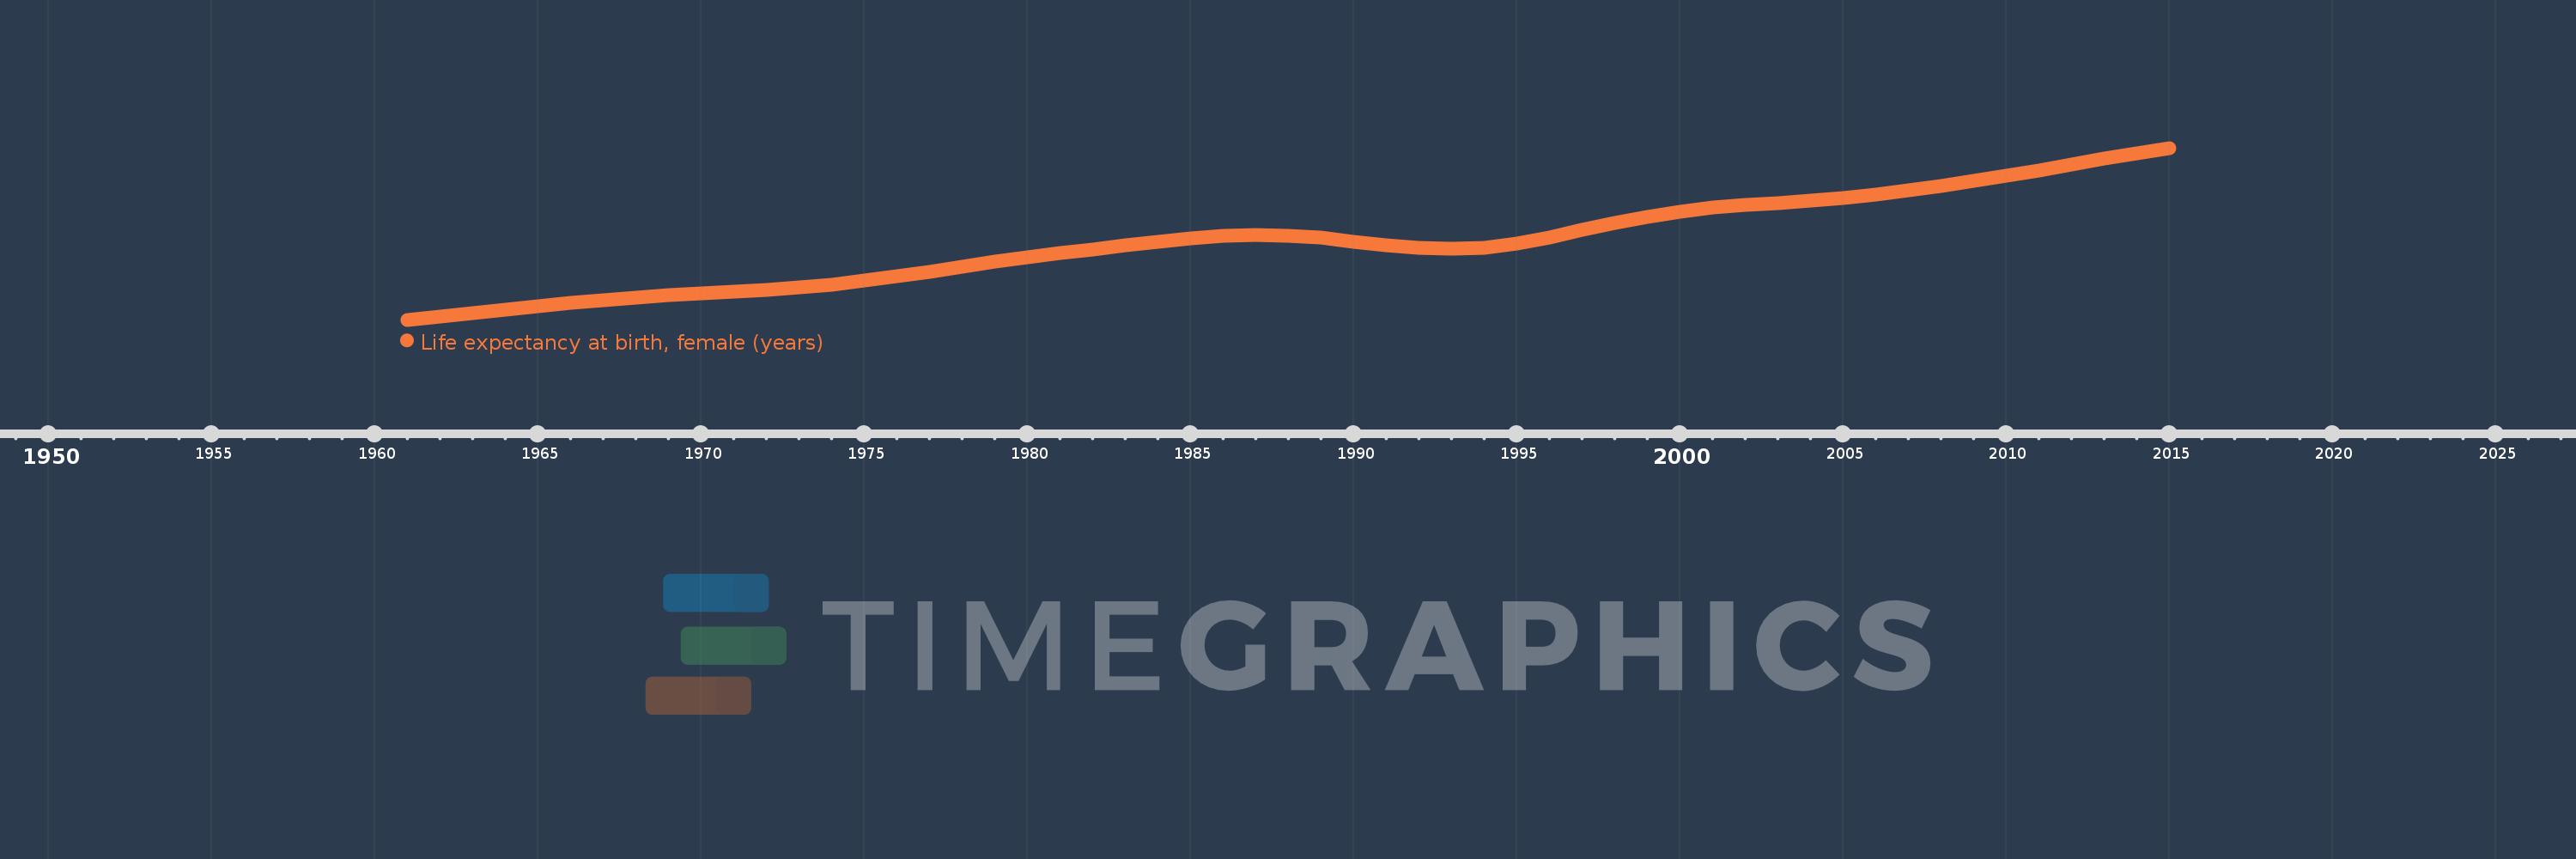
Life expectancy at birth, female (years)
2015,2014,2013,2012,2011,2010,2009,2008,2007,2006,2005,2004,2003,2002,2001,2000,1999,1998,1997,1996,1995,1994,1993,1992,1991,1990,1989,1988,1987,1986,1985,1984,1983,1982,1981,1980,1979,1978,1977,1976,1975,1974,1973,1972,1971,1970,1969,1968,1967,1966,1965,1964,1963,1962,1961
This statistics in other country:
AfghanistanAlbaniaAlgeriaAngolaAntigua and BarbudaArab WorldArgentinaArmeniaArubaAustraliaAustriaAzerbaijanBahamas, TheBahrainBangladeshBarbadosBelarusBelgiumBelizeBeninBermudaBhutanBoliviaBosnia and HerzegovinaBotswanaBrazilBrunei DarussalamBulgariaBurkina FasoBurundiCabo VerdeCambodiaCameroonCanadaCaribbean small statesCentral African RepublicCentral Europe and the BalticsChadChannel IslandsChileChinaColombiaComorosCongo, Dem. Rep.Congo, Rep.Costa RicaCote d'IvoireCroatiaCubaCuracaoCyprusCzech RepublicDenmarkDjiboutiDominicaDominican RepublicEarly-demographic dividendEast Asia & PacificEast Asia & Pacific (excluding high income)East Asia & Pacific (IDA & IBRD countries)EcuadorEgypt, Arab Rep.El SalvadorEquatorial GuineaEritreaEstoniaEthiopiaEuro areaEurope & Central AsiaEurope & Central Asia (excluding high income)Europe & Central Asia (IDA & IBRD countries)European UnionFaroe IslandsFijiFinlandFragile and conflict affected situationsFranceFrench PolynesiaGabonGambia, TheGeorgiaGermanyGhanaGreeceGreenlandGrenadaGuamGuatemalaGuineaGuinea-BissauGuyanaHaitiHeavily indebted poor countries (HIPC)High incomeHondurasHong Kong SAR, ChinaHungaryIBRD onlyIcelandIDA & IBRD totalIDA blendIDA onlyIDA totalIndiaIndonesiaIran, Islamic Rep.IraqIrelandIsle of ManIsraelItalyJamaicaJapanJordanKazakhstanKenyaKiribatiKorea, Dem. People’s Rep.Korea, Rep.KosovoKuwaitKyrgyz RepublicLao PDRLate-demographic dividendLatin America & Caribbean Latin America & Caribbean (excluding high income)Latin America & the Caribbean (IDA & IBRD countries)LatviaLeast developed countries: UN classificationLebanonLesothoLiberiaLibyaLiechtensteinLithuaniaLow & middle incomeLow incomeLower middle incomeLuxembourgMacao SAR, ChinaMacedonia, FYRMadagascarMalawiMalaysiaMaldivesMaliMaltaMarshall IslandsMauritaniaMauritiusMexicoMicronesia, Fed. Sts.Middle East & North AfricaMiddle East & North Africa (excluding high income)Middle East & North Africa (IDA & IBRD countries)Middle incomeMoldovaMongoliaMontenegroMoroccoMozambiqueMyanmarNamibiaNepalNetherlandsNew CaledoniaNew ZealandNicaraguaNigerNigeriaNorth AmericaNorwayOECD membersOmanOther small statesPacific island small statesPakistanPalauPanamaPapua New GuineaParaguayPeruPhilippinesPolandPortugalPost-demographic dividendPre-demographic dividendPuerto RicoQatarRomaniaRussian FederationRwandaSamoaSan MarinoSao Tome and PrincipeSaudi ArabiaSenegalSerbiaSeychellesSierra LeoneSingaporeSint Maarten (Dutch part)Slovak RepublicSloveniaSmall statesSolomon IslandsSomaliaSouth AfricaSouth AsiaSouth Asia (IDA & IBRD)South SudanSpainSri LankaSt. Kitts and NevisSt. LuciaSt. Martin (French part)St. Vincent and the GrenadinesSub-Saharan Africa Sub-Saharan Africa (excluding high income)Sub-Saharan Africa (IDA & IBRD countries)SudanSurinameSwazilandSwedenSwitzerlandSyrian Arab RepublicTajikistanTanzaniaThailandTimor-LesteTogoTongaTrinidad and TobagoTunisiaTurkeyTurkmenistanUgandaUkraineUnited Arab EmiratesUnited KingdomUnited StatesUpper middle incomeUruguayUzbekistanVanuatuVenezuela, RBVietnamVirgin Islands (U.S.)West Bank and GazaWorldYemen, Rep.ZambiaZimbabwe Timeline:
This timeline shows a graph from 1961 to 2015 of Burundi. No data until 1960. Number of actual observations by date: 55.
Source name:
World Development Indicators
Source organization:
(1) United Nations Population Division. World Population Prospects, (2) Census reports and other statistical publications from national statistical offices, (3) Eurostat: Demographic Statistics, (4) United Nations Statistical Division. Population and Vital Statistics Reprot (various years), (5) U.S. Census Bureau: International Database, and (6) Secretariat of the Pacific Community: Statistics and Demography Programme.
Categories, topics:
Health, Gender, Social Development
Last updated:
apr 23, 2017
Indicators value changes by year
Minimum:
42.851
jan 1, 1961
Maximum:
58.728
jan 1, 2015
At the date of observation
Value
Absolute change
Change from previous value
jan 1, 1961
42.851
+42.851
0.0%
jan 1, 1962
43.164
+0.313
0.73%
jan 1, 1963
43.482
+0.318
0.74%
jan 1, 1964
43.803
+0.321
0.74%
jan 1, 1965
44.121
+0.318
0.73%
jan 1, 1966
44.422
+0.301
0.68%
jan 1, 1967
44.69
+0.268
0.6%
jan 1, 1968
44.917
+0.227
0.51%
jan 1, 1969
45.107
+0.19
0.42%
jan 1, 1970
45.268
+0.161
0.36%
jan 1, 1971
45.423
+0.155
0.34%
jan 1, 1972
45.601
+0.178
0.39%
jan 1, 1973
45.825
+0.224
0.49%
jan 1, 1974
46.111
+0.286
0.62%
jan 1, 1975
46.458
+0.347
0.75%
jan 1, 1976
46.861
+0.403
0.87%
jan 1, 1977
47.303
+0.442
0.94%
jan 1, 1978
47.755
+0.452
0.96%
jan 1, 1979
48.194
+0.439
0.92%
jan 1, 1980
48.606
+0.412
0.85%
jan 1, 1981
48.992
+0.386
0.79%
jan 1, 1982
49.361
+0.369
0.75%
jan 1, 1983
49.72
+0.359
0.73%
jan 1, 1984
50.064
+0.344
0.69%
jan 1, 1985
50.377
+0.313
0.63%
jan 1, 1986
50.609
+0.232
0.46%
jan 1, 1987
50.701
+0.092
0.18%
jan 1, 1988
50.632
-0.069
-0.14%
jan 1, 1989
50.415
-0.217
-0.43%
jan 1, 1990
50.088
-0.327
-0.65%
jan 1, 1991
49.738
-0.35
-0.7%
jan 1, 1992
49.478
-0.26
-0.52%
jan 1, 1993
49.393
-0.085
-0.17%
jan 1, 1994
49.535
+0.142
0.29%
jan 1, 1995
49.908
+0.373
0.75%
jan 1, 1996
50.469
+0.561
1.12%
jan 1, 1997
51.138
+0.669
1.33%
jan 1, 1998
51.806
+0.668
1.31%
jan 1, 1999
52.391
+0.585
1.13%
jan 1, 2000
52.861
+0.47
0.9%
jan 1, 2001
53.208
+0.347
0.66%
jan 1, 2002
53.454
+0.246
0.46%
jan 1, 2003
53.66
+0.206
0.39%
jan 1, 2004
53.875
+0.215
0.4%
jan 1, 2005
54.123
+0.248
0.46%
jan 1, 2006
54.421
+0.298
0.55%
jan 1, 2007
54.781
+0.36
0.66%
jan 1, 2008
55.196
+0.415
0.76%
jan 1, 2009
55.654
+0.458
0.83%
jan 1, 2010
56.148
+0.494
0.89%
jan 1, 2011
56.669
+0.521
0.93%
jan 1, 2012
57.201
+0.532
0.94%
jan 1, 2013
57.73
+0.529
0.92%
jan 1, 2014
58.242
+0.512
0.89%
jan 1, 2015
58.728
+0.486
0.83%
Ranking of countries by current statistics by years


Comments: