29
/
en
AIzaSyAYiBZKx7MnpbEhh9jyipgxe19OcubqV5w
April 1, 2024
150616
Honduras
HND
true
2
1
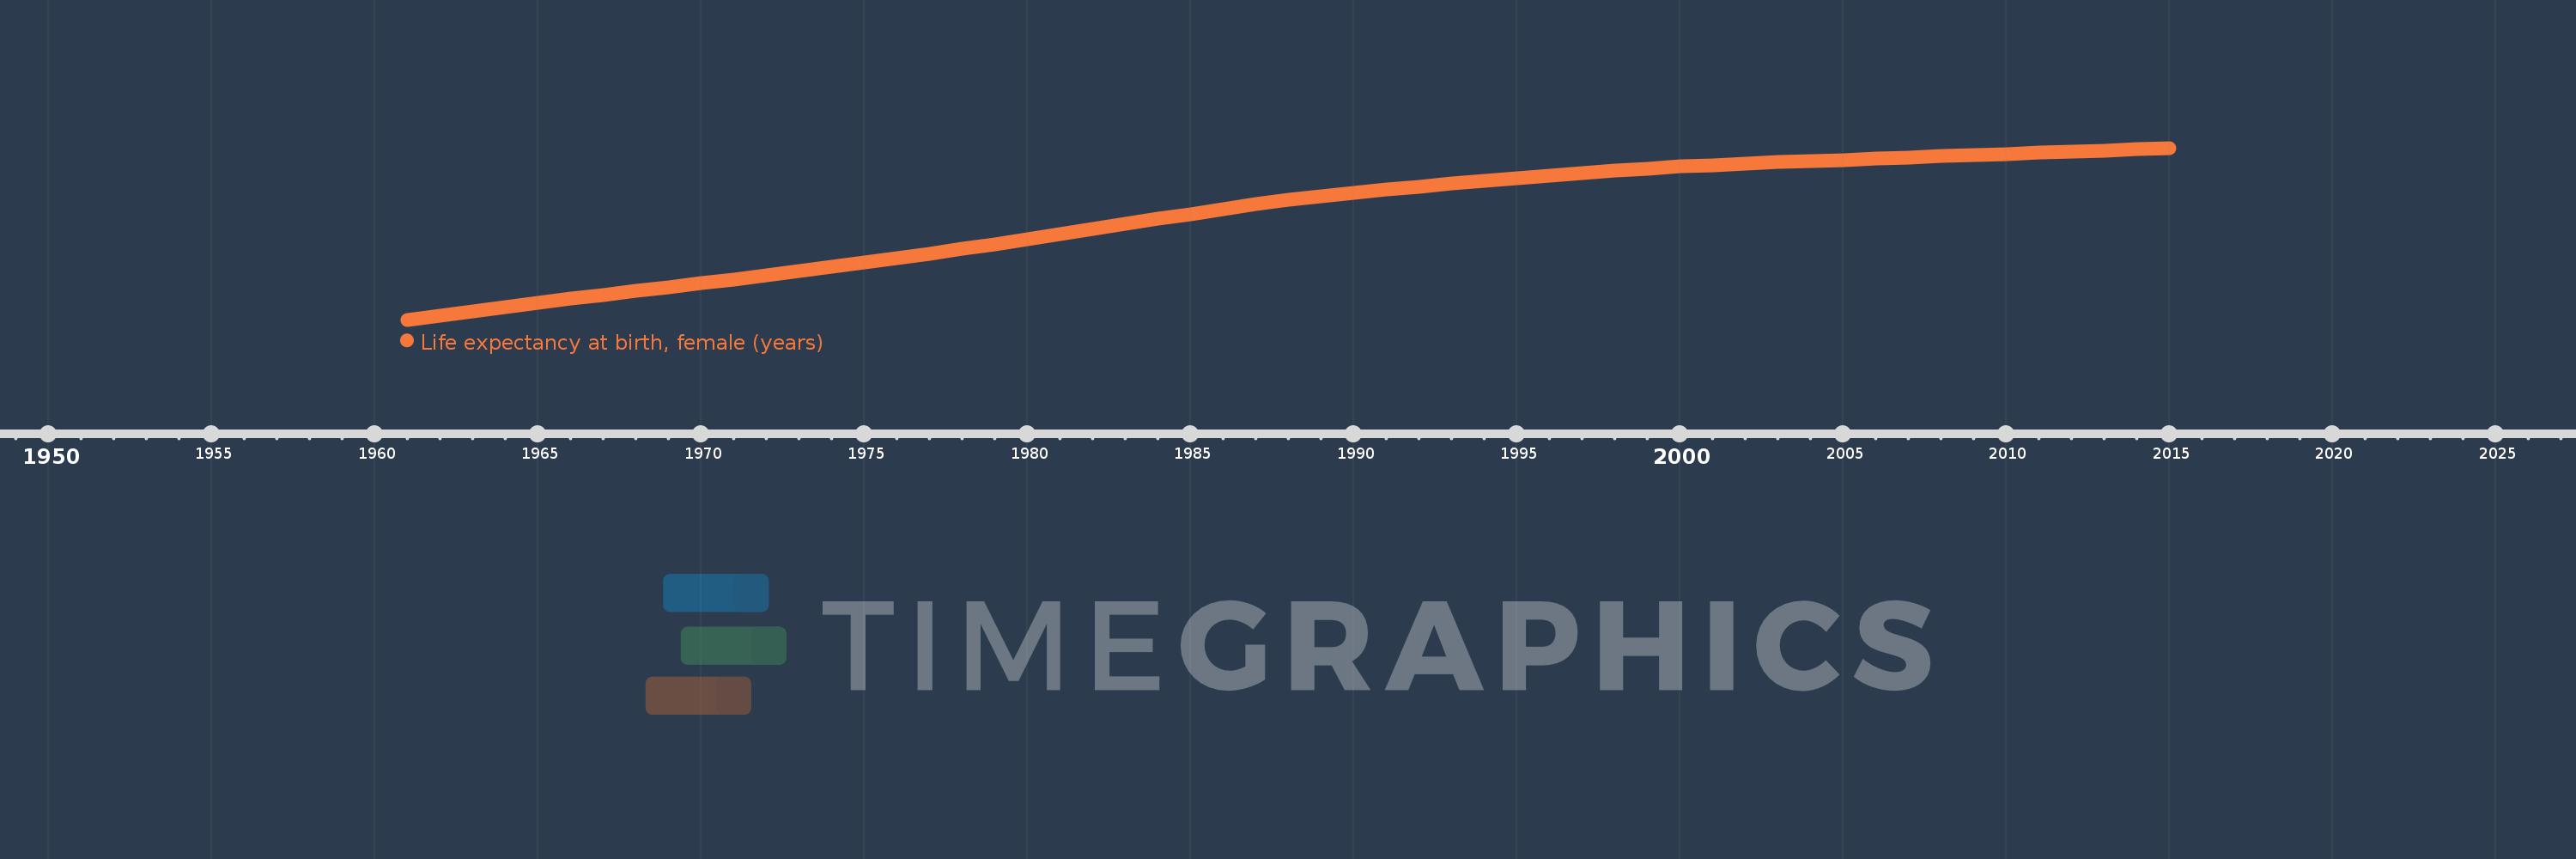
Life expectancy at birth, female (years)
2015,2014,2013,2012,2011,2010,2009,2008,2007,2006,2005,2004,2003,2002,2001,2000,1999,1998,1997,1996,1995,1994,1993,1992,1991,1990,1989,1988,1987,1986,1985,1984,1983,1982,1981,1980,1979,1978,1977,1976,1975,1974,1973,1972,1971,1970,1969,1968,1967,1966,1965,1964,1963,1962,1961
This statistics in other country:
AfghanistanAlbaniaAlgeriaAngolaAntigua and BarbudaArab WorldArgentinaArmeniaArubaAustraliaAustriaAzerbaijanBahamas, TheBahrainBangladeshBarbadosBelarusBelgiumBelizeBeninBermudaBhutanBoliviaBosnia and HerzegovinaBotswanaBrazilBrunei DarussalamBulgariaBurkina FasoBurundiCabo VerdeCambodiaCameroonCanadaCaribbean small statesCentral African RepublicCentral Europe and the BalticsChadChannel IslandsChileChinaColombiaComorosCongo, Dem. Rep.Congo, Rep.Costa RicaCote d'IvoireCroatiaCubaCuracaoCyprusCzech RepublicDenmarkDjiboutiDominicaDominican RepublicEarly-demographic dividendEast Asia & PacificEast Asia & Pacific (excluding high income)East Asia & Pacific (IDA & IBRD countries)EcuadorEgypt, Arab Rep.El SalvadorEquatorial GuineaEritreaEstoniaEthiopiaEuro areaEurope & Central AsiaEurope & Central Asia (excluding high income)Europe & Central Asia (IDA & IBRD countries)European UnionFaroe IslandsFijiFinlandFragile and conflict affected situationsFranceFrench PolynesiaGabonGambia, TheGeorgiaGermanyGhanaGreeceGreenlandGrenadaGuamGuatemalaGuineaGuinea-BissauGuyanaHaitiHeavily indebted poor countries (HIPC)High incomeHondurasHong Kong SAR, ChinaHungaryIBRD onlyIcelandIDA & IBRD totalIDA blendIDA onlyIDA totalIndiaIndonesiaIran, Islamic Rep.IraqIrelandIsle of ManIsraelItalyJamaicaJapanJordanKazakhstanKenyaKiribatiKorea, Dem. People’s Rep.Korea, Rep.KosovoKuwaitKyrgyz RepublicLao PDRLate-demographic dividendLatin America & Caribbean Latin America & Caribbean (excluding high income)Latin America & the Caribbean (IDA & IBRD countries)LatviaLeast developed countries: UN classificationLebanonLesothoLiberiaLibyaLiechtensteinLithuaniaLow & middle incomeLow incomeLower middle incomeLuxembourgMacao SAR, ChinaMacedonia, FYRMadagascarMalawiMalaysiaMaldivesMaliMaltaMarshall IslandsMauritaniaMauritiusMexicoMicronesia, Fed. Sts.Middle East & North AfricaMiddle East & North Africa (excluding high income)Middle East & North Africa (IDA & IBRD countries)Middle incomeMoldovaMongoliaMontenegroMoroccoMozambiqueMyanmarNamibiaNepalNetherlandsNew CaledoniaNew ZealandNicaraguaNigerNigeriaNorth AmericaNorwayOECD membersOmanOther small statesPacific island small statesPakistanPalauPanamaPapua New GuineaParaguayPeruPhilippinesPolandPortugalPost-demographic dividendPre-demographic dividendPuerto RicoQatarRomaniaRussian FederationRwandaSamoaSan MarinoSao Tome and PrincipeSaudi ArabiaSenegalSerbiaSeychellesSierra LeoneSingaporeSint Maarten (Dutch part)Slovak RepublicSloveniaSmall statesSolomon IslandsSomaliaSouth AfricaSouth AsiaSouth Asia (IDA & IBRD)South SudanSpainSri LankaSt. Kitts and NevisSt. LuciaSt. Martin (French part)St. Vincent and the GrenadinesSub-Saharan Africa Sub-Saharan Africa (excluding high income)Sub-Saharan Africa (IDA & IBRD countries)SudanSurinameSwazilandSwedenSwitzerlandSyrian Arab RepublicTajikistanTanzaniaThailandTimor-LesteTogoTongaTrinidad and TobagoTunisiaTurkeyTurkmenistanUgandaUkraineUnited Arab EmiratesUnited KingdomUnited StatesUpper middle incomeUruguayUzbekistanVanuatuVenezuela, RBVietnamVirgin Islands (U.S.)West Bank and GazaWorldYemen, Rep.ZambiaZimbabwe Timeline:
This timeline shows a graph from 1961 to 2015 of Honduras. No data until 1960. Number of actual observations by date: 55.
Source name:
World Development Indicators
Source organization:
(1) United Nations Population Division. World Population Prospects, (2) Census reports and other statistical publications from national statistical offices, (3) Eurostat: Demographic Statistics, (4) United Nations Statistical Division. Population and Vital Statistics Reprot (various years), (5) U.S. Census Bureau: International Database, and (6) Secretariat of the Pacific Community: Statistics and Demography Programme.
Categories, topics:
Health, Gender, Social Development
Last updated:
apr 23, 2017
Indicators value changes by year
Minimum:
48.039
jan 1, 1961
At the date of observation
Value
Absolute change
Change from previous value
jan 1, 1961
48.039
+48.039
0.0%
jan 1, 1962
48.733
+0.694
1.44%
jan 1, 1963
49.42
+0.687
1.41%
jan 1, 1964
50.095
+0.675
1.37%
jan 1, 1965
50.756
+0.661
1.32%
jan 1, 1966
51.401
+0.645
1.27%
jan 1, 1967
52.031
+0.63
1.23%
jan 1, 1968
52.653
+0.622
1.2%
jan 1, 1969
53.272
+0.619
1.18%
jan 1, 1970
53.894
+0.622
1.17%
jan 1, 1971
54.525
+0.631
1.17%
jan 1, 1972
55.172
+0.647
1.19%
jan 1, 1973
55.836
+0.664
1.2%
jan 1, 1974
56.52
+0.684
1.23%
jan 1, 1975
57.226
+0.706
1.25%
jan 1, 1976
57.953
+0.727
1.27%
jan 1, 1977
58.701
+0.748
1.29%
jan 1, 1978
59.464
+0.763
1.3%
jan 1, 1979
60.238
+0.774
1.3%
jan 1, 1980
61.02
+0.782
1.3%
jan 1, 1981
61.812
+0.792
1.3%
jan 1, 1982
62.617
+0.805
1.3%
jan 1, 1983
63.435
+0.818
1.31%
jan 1, 1984
64.259
+0.824
1.3%
jan 1, 1985
65.077
+0.818
1.27%
jan 1, 1986
65.871
+0.794
1.22%
jan 1, 1987
66.621
+0.75
1.14%
jan 1, 1988
67.313
+0.692
1.04%
jan 1, 1989
67.943
+0.63
0.94%
jan 1, 1990
68.507
+0.564
0.83%
jan 1, 1991
69.018
+0.511
0.75%
jan 1, 1992
69.49
+0.472
0.68%
jan 1, 1993
69.944
+0.454
0.65%
jan 1, 1994
70.392
+0.448
0.64%
jan 1, 1995
70.839
+0.447
0.64%
jan 1, 1996
71.278
+0.439
0.62%
jan 1, 1997
71.697
+0.419
0.59%
jan 1, 1998
72.079
+0.382
0.53%
jan 1, 1999
72.417
+0.338
0.47%
jan 1, 2000
72.711
+0.294
0.41%
jan 1, 2001
72.964
+0.253
0.35%
jan 1, 2002
73.185
+0.221
0.3%
jan 1, 2003
73.387
+0.202
0.28%
jan 1, 2004
73.583
+0.196
0.27%
jan 1, 2005
73.778
+0.195
0.27%
jan 1, 2006
73.974
+0.196
0.27%
jan 1, 2007
74.173
+0.199
0.27%
jan 1, 2008
74.369
+0.196
0.26%
jan 1, 2009
74.561
+0.192
0.26%
jan 1, 2010
74.749
+0.188
0.25%
jan 1, 2011
74.936
+0.187
0.25%
jan 1, 2012
75.125
+0.189
0.25%
jan 1, 2013
75.316
+0.191
0.25%
jan 1, 2014
75.511
+0.195
0.26%
jan 1, 2015
75.71
+0.199
0.26%
Ranking of countries by current statistics by years


Comments: