29
/
en
AIzaSyAYiBZKx7MnpbEhh9jyipgxe19OcubqV5w
April 1, 2024
222426
Peru
PER
true
2
1
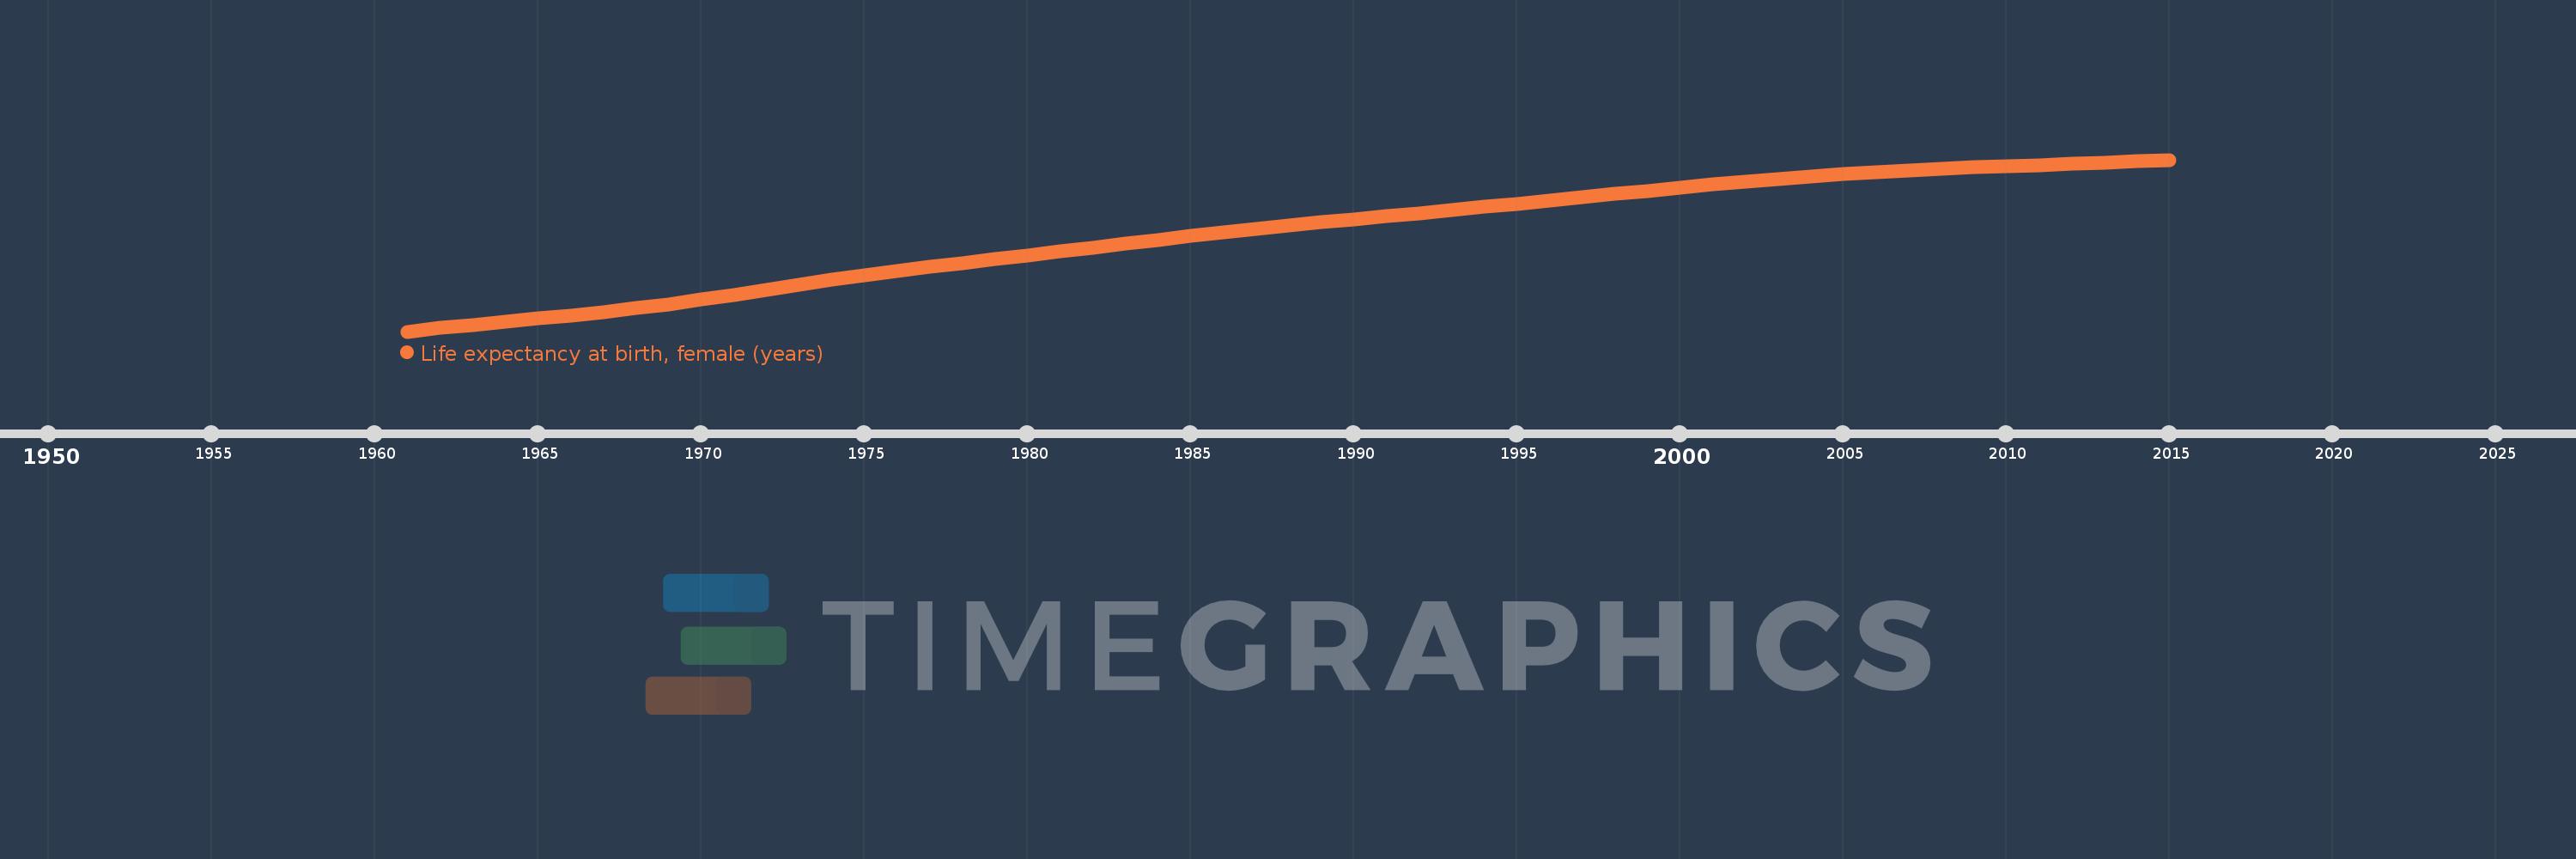
Life expectancy at birth, female (years)
2015,2014,2013,2012,2011,2010,2009,2008,2007,2006,2005,2004,2003,2002,2001,2000,1999,1998,1997,1996,1995,1994,1993,1992,1991,1990,1989,1988,1987,1986,1985,1984,1983,1982,1981,1980,1979,1978,1977,1976,1975,1974,1973,1972,1971,1970,1969,1968,1967,1966,1965,1964,1963,1962,1961
This statistics in other country:
AfghanistanAlbaniaAlgeriaAngolaAntigua and BarbudaArab WorldArgentinaArmeniaArubaAustraliaAustriaAzerbaijanBahamas, TheBahrainBangladeshBarbadosBelarusBelgiumBelizeBeninBermudaBhutanBoliviaBosnia and HerzegovinaBotswanaBrazilBrunei DarussalamBulgariaBurkina FasoBurundiCabo VerdeCambodiaCameroonCanadaCaribbean small statesCentral African RepublicCentral Europe and the BalticsChadChannel IslandsChileChinaColombiaComorosCongo, Dem. Rep.Congo, Rep.Costa RicaCote d'IvoireCroatiaCubaCuracaoCyprusCzech RepublicDenmarkDjiboutiDominicaDominican RepublicEarly-demographic dividendEast Asia & PacificEast Asia & Pacific (excluding high income)East Asia & Pacific (IDA & IBRD countries)EcuadorEgypt, Arab Rep.El SalvadorEquatorial GuineaEritreaEstoniaEthiopiaEuro areaEurope & Central AsiaEurope & Central Asia (excluding high income)Europe & Central Asia (IDA & IBRD countries)European UnionFaroe IslandsFijiFinlandFragile and conflict affected situationsFranceFrench PolynesiaGabonGambia, TheGeorgiaGermanyGhanaGreeceGreenlandGrenadaGuamGuatemalaGuineaGuinea-BissauGuyanaHaitiHeavily indebted poor countries (HIPC)High incomeHondurasHong Kong SAR, ChinaHungaryIBRD onlyIcelandIDA & IBRD totalIDA blendIDA onlyIDA totalIndiaIndonesiaIran, Islamic Rep.IraqIrelandIsle of ManIsraelItalyJamaicaJapanJordanKazakhstanKenyaKiribatiKorea, Dem. People’s Rep.Korea, Rep.KosovoKuwaitKyrgyz RepublicLao PDRLate-demographic dividendLatin America & Caribbean Latin America & Caribbean (excluding high income)Latin America & the Caribbean (IDA & IBRD countries)LatviaLeast developed countries: UN classificationLebanonLesothoLiberiaLibyaLiechtensteinLithuaniaLow & middle incomeLow incomeLower middle incomeLuxembourgMacao SAR, ChinaMacedonia, FYRMadagascarMalawiMalaysiaMaldivesMaliMaltaMarshall IslandsMauritaniaMauritiusMexicoMicronesia, Fed. Sts.Middle East & North AfricaMiddle East & North Africa (excluding high income)Middle East & North Africa (IDA & IBRD countries)Middle incomeMoldovaMongoliaMontenegroMoroccoMozambiqueMyanmarNamibiaNepalNetherlandsNew CaledoniaNew ZealandNicaraguaNigerNigeriaNorth AmericaNorwayOECD membersOmanOther small statesPacific island small statesPakistanPalauPanamaPapua New GuineaParaguayPeruPhilippinesPolandPortugalPost-demographic dividendPre-demographic dividendPuerto RicoQatarRomaniaRussian FederationRwandaSamoaSan MarinoSao Tome and PrincipeSaudi ArabiaSenegalSerbiaSeychellesSierra LeoneSingaporeSint Maarten (Dutch part)Slovak RepublicSloveniaSmall statesSolomon IslandsSomaliaSouth AfricaSouth AsiaSouth Asia (IDA & IBRD)South SudanSpainSri LankaSt. Kitts and NevisSt. LuciaSt. Martin (French part)St. Vincent and the GrenadinesSub-Saharan Africa Sub-Saharan Africa (excluding high income)Sub-Saharan Africa (IDA & IBRD countries)SudanSurinameSwazilandSwedenSwitzerlandSyrian Arab RepublicTajikistanTanzaniaThailandTimor-LesteTogoTongaTrinidad and TobagoTunisiaTurkeyTurkmenistanUgandaUkraineUnited Arab EmiratesUnited KingdomUnited StatesUpper middle incomeUruguayUzbekistanVanuatuVenezuela, RBVietnamVirgin Islands (U.S.)West Bank and GazaWorldYemen, Rep.ZambiaZimbabwe Timeline:
This timeline shows a graph from 1961 to 2015 of Peru. No data until 1960. Number of actual observations by date: 55.
Source name:
World Development Indicators
Source organization:
(1) United Nations Population Division. World Population Prospects, (2) Census reports and other statistical publications from national statistical offices, (3) Eurostat: Demographic Statistics, (4) United Nations Statistical Division. Population and Vital Statistics Reprot (various years), (5) U.S. Census Bureau: International Database, and (6) Secretariat of the Pacific Community: Statistics and Demography Programme.
Categories, topics:
Health, Gender, Social Development
Last updated:
apr 23, 2017
Indicators value changes by year
Maximum:
77.233
jan 1, 2015
At the date of observation
Value
Absolute change
Change from previous value
jan 1, 1961
48.99
+48.99
0.0%
jan 1, 1962
49.559
+0.569
1.16%
jan 1, 1963
50.106
+0.547
1.1%
jan 1, 1964
50.628
+0.522
1.04%
jan 1, 1965
51.133
+0.505
1.0%
jan 1, 1966
51.645
+0.512
1.0%
jan 1, 1967
52.195
+0.55
1.06%
jan 1, 1968
52.808
+0.613
1.17%
jan 1, 1969
53.494
+0.686
1.3%
jan 1, 1970
54.251
+0.757
1.42%
jan 1, 1971
55.06
+0.809
1.49%
jan 1, 1972
55.893
+0.833
1.51%
jan 1, 1973
56.715
+0.822
1.47%
jan 1, 1974
57.501
+0.786
1.39%
jan 1, 1975
58.24
+0.739
1.29%
jan 1, 1976
58.931
+0.691
1.19%
jan 1, 1977
59.584
+0.653
1.11%
jan 1, 1978
60.22
+0.636
1.07%
jan 1, 1979
60.855
+0.635
1.05%
jan 1, 1980
61.493
+0.638
1.05%
jan 1, 1981
62.137
+0.644
1.05%
jan 1, 1982
62.783
+0.646
1.04%
jan 1, 1983
63.425
+0.642
1.02%
jan 1, 1984
64.056
+0.631
0.99%
jan 1, 1985
64.673
+0.617
0.96%
jan 1, 1986
65.272
+0.599
0.93%
jan 1, 1987
65.849
+0.577
0.88%
jan 1, 1988
66.404
+0.555
0.84%
jan 1, 1989
66.94
+0.536
0.81%
jan 1, 1990
67.46
+0.52
0.78%
jan 1, 1991
67.969
+0.509
0.75%
jan 1, 1992
68.474
+0.505
0.74%
jan 1, 1993
68.98
+0.506
0.74%
jan 1, 1994
69.492
+0.512
0.74%
jan 1, 1995
70.011
+0.519
0.75%
jan 1, 1996
70.538
+0.527
0.75%
jan 1, 1997
71.075
+0.537
0.76%
jan 1, 1998
71.614
+0.539
0.76%
jan 1, 1999
72.149
+0.535
0.75%
jan 1, 2000
72.672
+0.523
0.72%
jan 1, 2001
73.177
+0.505
0.69%
jan 1, 2002
73.653
+0.476
0.65%
jan 1, 2003
74.098
+0.445
0.6%
jan 1, 2004
74.507
+0.409
0.55%
jan 1, 2005
74.879
+0.372
0.5%
jan 1, 2006
75.209
+0.33
0.44%
jan 1, 2007
75.497
+0.288
0.38%
jan 1, 2008
75.75
+0.253
0.34%
jan 1, 2009
75.975
+0.225
0.3%
jan 1, 2010
76.181
+0.206
0.27%
jan 1, 2011
76.378
+0.197
0.26%
jan 1, 2012
76.576
+0.198
0.26%
jan 1, 2013
76.781
+0.205
0.27%
jan 1, 2014
76.999
+0.218
0.28%
jan 1, 2015
77.233
+0.234
0.3%
Ranking of countries by current statistics by years


Comments: