29
/
en
AIzaSyAYiBZKx7MnpbEhh9jyipgxe19OcubqV5w
April 1, 2024
30842
Europe & Central Asia
ECS
false
2
1
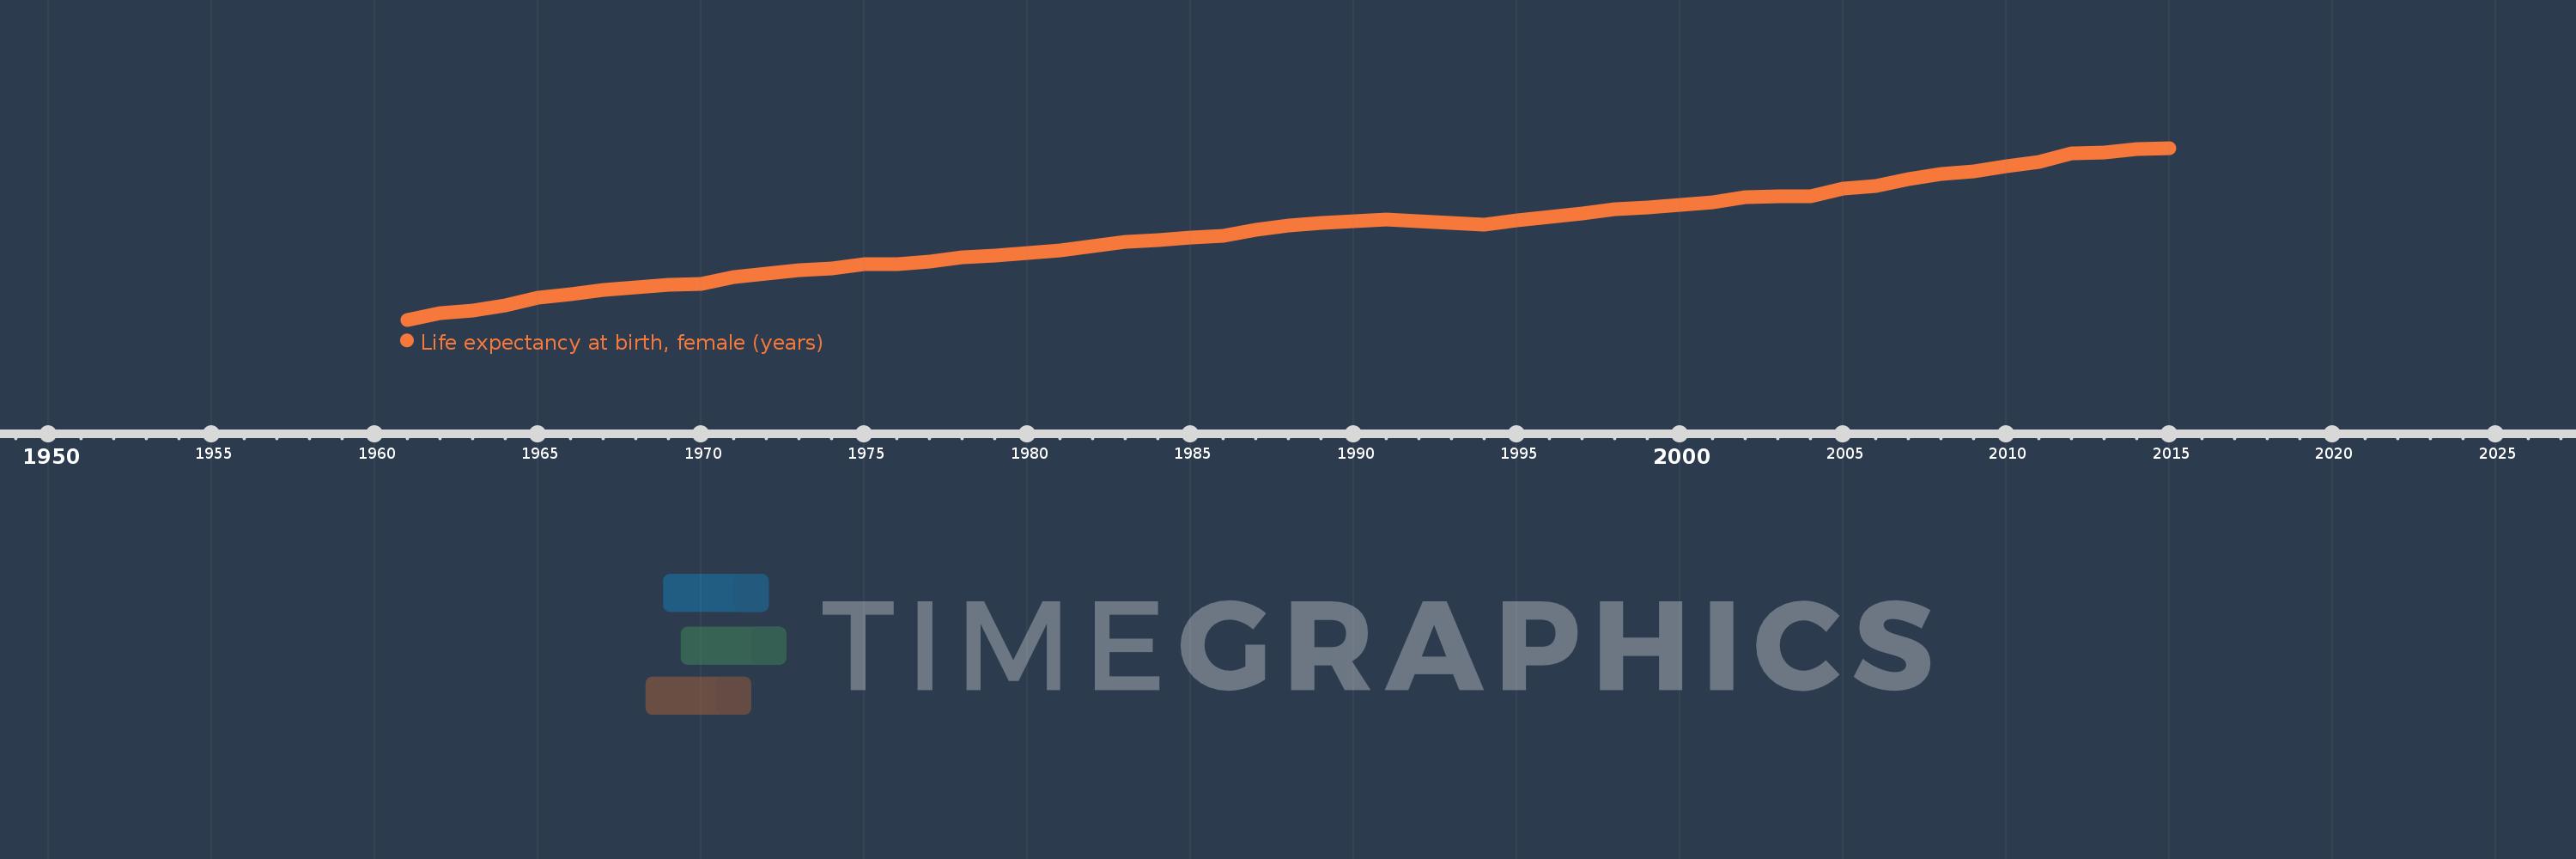
Life expectancy at birth, female (years)
2015,2014,2013,2012,2011,2010,2009,2008,2007,2006,2005,2004,2003,2002,2001,2000,1999,1998,1997,1996,1995,1994,1993,1992,1991,1990,1989,1988,1987,1986,1985,1984,1983,1982,1981,1980,1979,1978,1977,1976,1975,1974,1973,1972,1971,1970,1969,1968,1967,1966,1965,1964,1963,1962,1961
This statistics in other country:
AfghanistanAlbaniaAlgeriaAngolaAntigua and BarbudaArab WorldArgentinaArmeniaArubaAustraliaAustriaAzerbaijanBahamas, TheBahrainBangladeshBarbadosBelarusBelgiumBelizeBeninBermudaBhutanBoliviaBosnia and HerzegovinaBotswanaBrazilBrunei DarussalamBulgariaBurkina FasoBurundiCabo VerdeCambodiaCameroonCanadaCaribbean small statesCentral African RepublicCentral Europe and the BalticsChadChannel IslandsChileChinaColombiaComorosCongo, Dem. Rep.Congo, Rep.Costa RicaCote d'IvoireCroatiaCubaCuracaoCyprusCzech RepublicDenmarkDjiboutiDominicaDominican RepublicEarly-demographic dividendEast Asia & PacificEast Asia & Pacific (excluding high income)East Asia & Pacific (IDA & IBRD countries)EcuadorEgypt, Arab Rep.El SalvadorEquatorial GuineaEritreaEstoniaEthiopiaEuro areaEurope & Central AsiaEurope & Central Asia (excluding high income)Europe & Central Asia (IDA & IBRD countries)European UnionFaroe IslandsFijiFinlandFragile and conflict affected situationsFranceFrench PolynesiaGabonGambia, TheGeorgiaGermanyGhanaGreeceGreenlandGrenadaGuamGuatemalaGuineaGuinea-BissauGuyanaHaitiHeavily indebted poor countries (HIPC)High incomeHondurasHong Kong SAR, ChinaHungaryIBRD onlyIcelandIDA & IBRD totalIDA blendIDA onlyIDA totalIndiaIndonesiaIran, Islamic Rep.IraqIrelandIsle of ManIsraelItalyJamaicaJapanJordanKazakhstanKenyaKiribatiKorea, Dem. People’s Rep.Korea, Rep.KosovoKuwaitKyrgyz RepublicLao PDRLate-demographic dividendLatin America & Caribbean Latin America & Caribbean (excluding high income)Latin America & the Caribbean (IDA & IBRD countries)LatviaLeast developed countries: UN classificationLebanonLesothoLiberiaLibyaLiechtensteinLithuaniaLow & middle incomeLow incomeLower middle incomeLuxembourgMacao SAR, ChinaMacedonia, FYRMadagascarMalawiMalaysiaMaldivesMaliMaltaMarshall IslandsMauritaniaMauritiusMexicoMicronesia, Fed. Sts.Middle East & North AfricaMiddle East & North Africa (excluding high income)Middle East & North Africa (IDA & IBRD countries)Middle incomeMoldovaMongoliaMontenegroMoroccoMozambiqueMyanmarNamibiaNepalNetherlandsNew CaledoniaNew ZealandNicaraguaNigerNigeriaNorth AmericaNorwayOECD membersOmanOther small statesPacific island small statesPakistanPalauPanamaPapua New GuineaParaguayPeruPhilippinesPolandPortugalPost-demographic dividendPre-demographic dividendPuerto RicoQatarRomaniaRussian FederationRwandaSamoaSan MarinoSao Tome and PrincipeSaudi ArabiaSenegalSerbiaSeychellesSierra LeoneSingaporeSint Maarten (Dutch part)Slovak RepublicSloveniaSmall statesSolomon IslandsSomaliaSouth AfricaSouth AsiaSouth Asia (IDA & IBRD)South SudanSpainSri LankaSt. Kitts and NevisSt. LuciaSt. Martin (French part)St. Vincent and the GrenadinesSub-Saharan Africa Sub-Saharan Africa (excluding high income)Sub-Saharan Africa (IDA & IBRD countries)SudanSurinameSwazilandSwedenSwitzerlandSyrian Arab RepublicTajikistanTanzaniaThailandTimor-LesteTogoTongaTrinidad and TobagoTunisiaTurkeyTurkmenistanUgandaUkraineUnited Arab EmiratesUnited KingdomUnited StatesUpper middle incomeUruguayUzbekistanVanuatuVenezuela, RBVietnamVirgin Islands (U.S.)West Bank and GazaWorldYemen, Rep.ZambiaZimbabwe Timeline:
This timeline shows a graph from 1961 to 2015 of Europe & Central Asia. No data until 1960. Number of actual observations by date: 55.
Source name:
World Development Indicators
Source organization:
(1) United Nations Population Division. World Population Prospects, (2) Census reports and other statistical publications from national statistical offices, (3) Eurostat: Demographic Statistics, (4) United Nations Statistical Division. Population and Vital Statistics Reprot (various years), (5) U.S. Census Bureau: International Database, and (6) Secretariat of the Pacific Community: Statistics and Demography Programme.
Categories, topics:
Health, Gender, Social Development
Last updated:
apr 23, 2017
Indicators value changes by year
Maximum:
80.375
jan 1, 2015
At the date of observation
Value
Absolute change
Change from previous value
jan 1, 1961
70.14
+70.14
0.0%
jan 1, 1962
70.546
+0.406
0.58%
jan 1, 1963
70.687
+0.141
0.2%
jan 1, 1964
71.002
+0.315
0.45%
jan 1, 1965
71.448
+0.446
0.63%
jan 1, 1966
71.643
+0.195
0.27%
jan 1, 1967
71.905
+0.262
0.37%
jan 1, 1968
72.087
+0.182
0.25%
jan 1, 1969
72.218
+0.131
0.18%
jan 1, 1970
72.295
+0.078
0.11%
jan 1, 1971
72.67
+0.375
0.52%
jan 1, 1972
72.881
+0.211
0.29%
jan 1, 1973
73.07
+0.189
0.26%
jan 1, 1974
73.184
+0.113
0.16%
jan 1, 1975
73.445
+0.261
0.36%
jan 1, 1976
73.471
+0.026
0.04%
jan 1, 1977
73.604
+0.133
0.18%
jan 1, 1978
73.867
+0.263
0.36%
jan 1, 1979
73.977
+0.11
0.15%
jan 1, 1980
74.132
+0.155
0.21%
jan 1, 1981
74.261
+0.129
0.17%
jan 1, 1982
74.532
+0.272
0.37%
jan 1, 1983
74.797
+0.265
0.36%
jan 1, 1984
74.861
+0.064
0.08%
jan 1, 1985
75.018
+0.157
0.21%
jan 1, 1986
75.148
+0.13
0.17%
jan 1, 1987
75.522
+0.374
0.5%
jan 1, 1988
75.74
+0.217
0.29%
jan 1, 1989
75.895
+0.155
0.21%
jan 1, 1990
76.023
+0.128
0.17%
jan 1, 1991
76.09
+0.067
0.09%
jan 1, 1992
76.015
-0.075
-0.1%
jan 1, 1993
75.928
-0.087
-0.11%
jan 1, 1994
75.793
-0.135
-0.18%
jan 1, 1995
76.05
+0.257
0.34%
jan 1, 1996
76.264
+0.214
0.28%
jan 1, 1997
76.495
+0.231
0.3%
jan 1, 1998
76.745
+0.249
0.33%
jan 1, 1999
76.83
+0.086
0.11%
jan 1, 2000
77.007
+0.177
0.23%
jan 1, 2001
77.123
+0.117
0.15%
jan 1, 2002
77.432
+0.309
0.4%
jan 1, 2003
77.475
+0.043
0.05%
jan 1, 2004
77.511
+0.037
0.05%
jan 1, 2005
77.949
+0.437
0.56%
jan 1, 2006
78.095
+0.146
0.19%
jan 1, 2007
78.514
+0.42
0.54%
jan 1, 2008
78.811
+0.296
0.38%
jan 1, 2009
78.993
+0.182
0.23%
jan 1, 2010
79.3
+0.306
0.39%
jan 1, 2011
79.528
+0.228
0.29%
jan 1, 2012
80.03
+0.503
0.63%
jan 1, 2013
80.109
+0.079
0.1%
jan 1, 2014
80.302
+0.193
0.24%
jan 1, 2015
80.375
+0.073
0.09%
Ranking of countries by current statistics by years


Comments: