29
/
en
AIzaSyAYiBZKx7MnpbEhh9jyipgxe19OcubqV5w
April 1, 2024
145888
Guinea
GIN
true
2
1
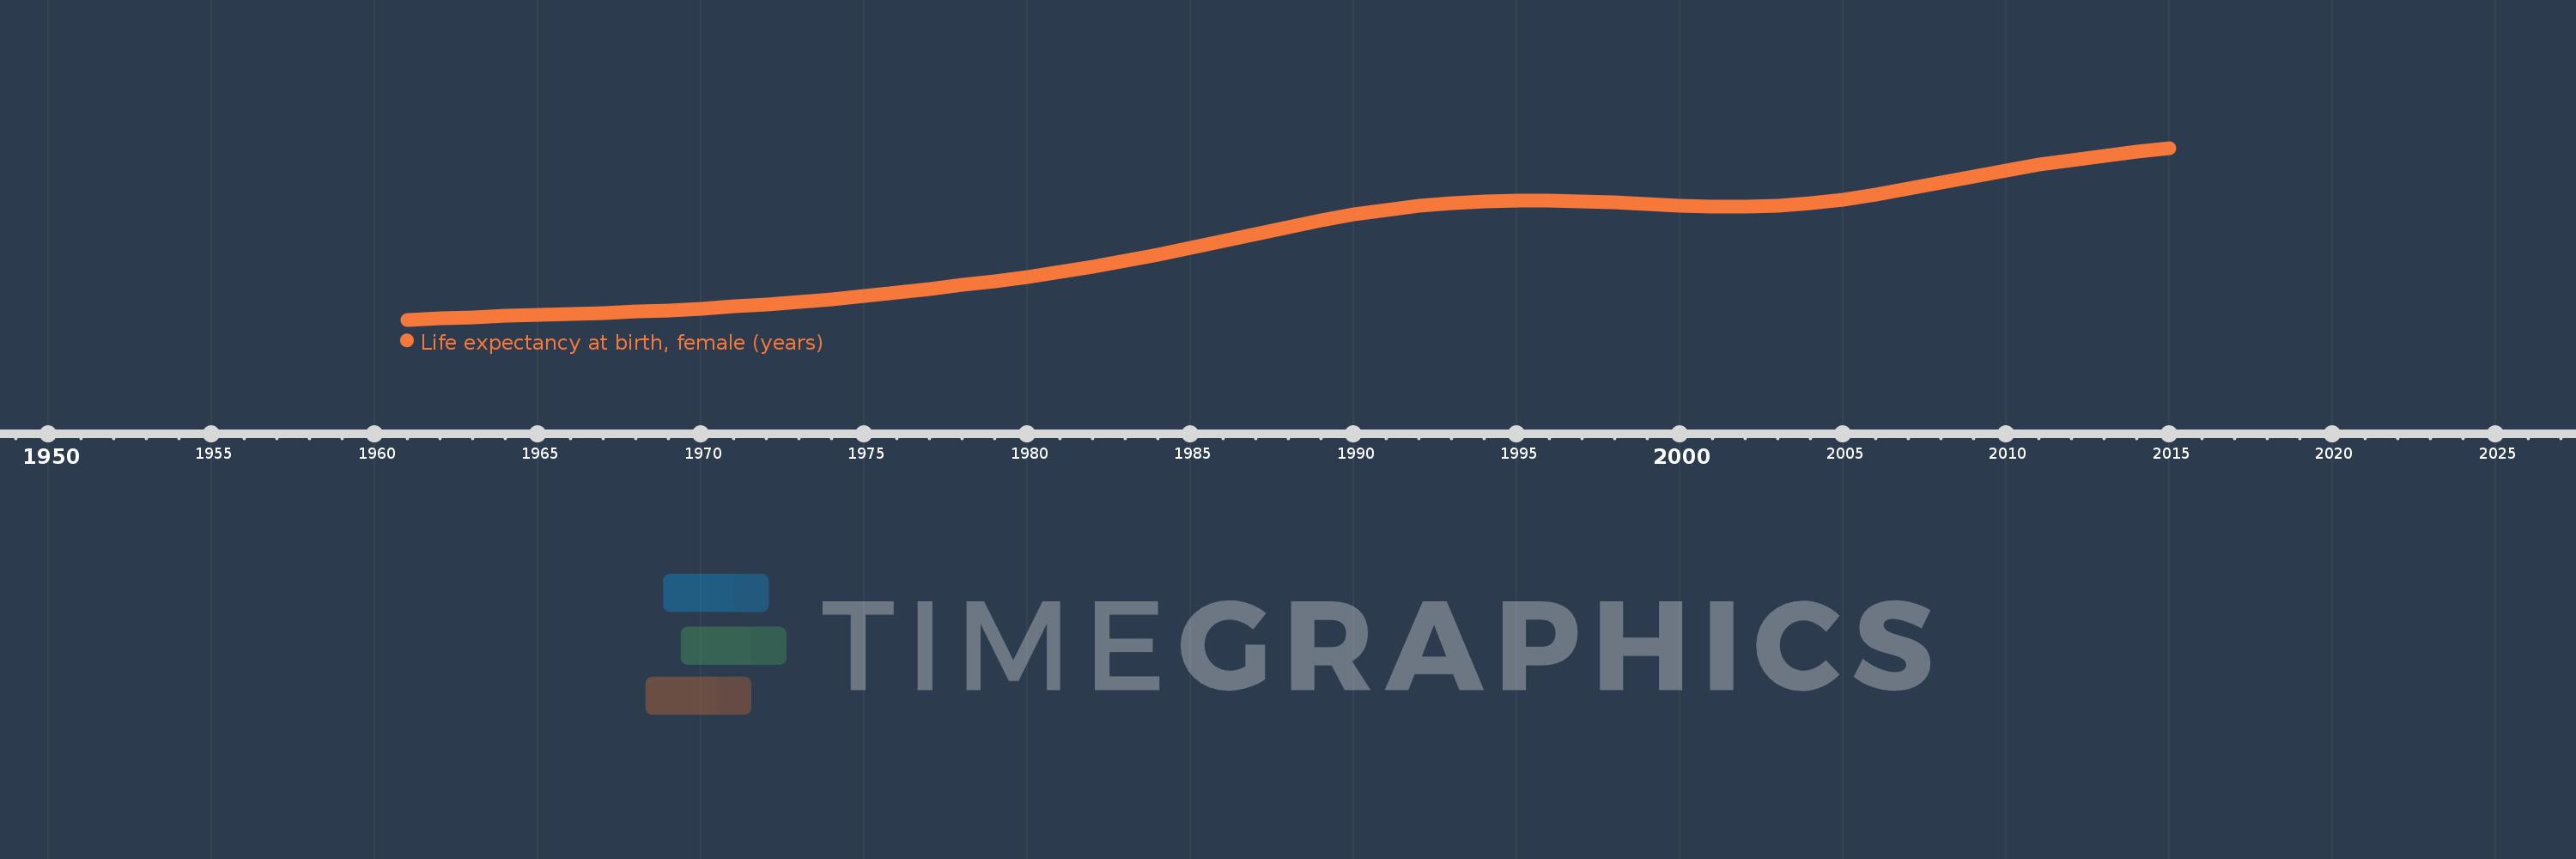
Life expectancy at birth, female (years)
2015,2014,2013,2012,2011,2010,2009,2008,2007,2006,2005,2004,2003,2002,2001,2000,1999,1998,1997,1996,1995,1994,1993,1992,1991,1990,1989,1988,1987,1986,1985,1984,1983,1982,1981,1980,1979,1978,1977,1976,1975,1974,1973,1972,1971,1970,1969,1968,1967,1966,1965,1964,1963,1962,1961
This statistics in other country:
AfghanistanAlbaniaAlgeriaAngolaAntigua and BarbudaArab WorldArgentinaArmeniaArubaAustraliaAustriaAzerbaijanBahamas, TheBahrainBangladeshBarbadosBelarusBelgiumBelizeBeninBermudaBhutanBoliviaBosnia and HerzegovinaBotswanaBrazilBrunei DarussalamBulgariaBurkina FasoBurundiCabo VerdeCambodiaCameroonCanadaCaribbean small statesCentral African RepublicCentral Europe and the BalticsChadChannel IslandsChileChinaColombiaComorosCongo, Dem. Rep.Congo, Rep.Costa RicaCote d'IvoireCroatiaCubaCuracaoCyprusCzech RepublicDenmarkDjiboutiDominicaDominican RepublicEarly-demographic dividendEast Asia & PacificEast Asia & Pacific (excluding high income)East Asia & Pacific (IDA & IBRD countries)EcuadorEgypt, Arab Rep.El SalvadorEquatorial GuineaEritreaEstoniaEthiopiaEuro areaEurope & Central AsiaEurope & Central Asia (excluding high income)Europe & Central Asia (IDA & IBRD countries)European UnionFaroe IslandsFijiFinlandFragile and conflict affected situationsFranceFrench PolynesiaGabonGambia, TheGeorgiaGermanyGhanaGreeceGreenlandGrenadaGuamGuatemalaGuineaGuinea-BissauGuyanaHaitiHeavily indebted poor countries (HIPC)High incomeHondurasHong Kong SAR, ChinaHungaryIBRD onlyIcelandIDA & IBRD totalIDA blendIDA onlyIDA totalIndiaIndonesiaIran, Islamic Rep.IraqIrelandIsle of ManIsraelItalyJamaicaJapanJordanKazakhstanKenyaKiribatiKorea, Dem. People’s Rep.Korea, Rep.KosovoKuwaitKyrgyz RepublicLao PDRLate-demographic dividendLatin America & Caribbean Latin America & Caribbean (excluding high income)Latin America & the Caribbean (IDA & IBRD countries)LatviaLeast developed countries: UN classificationLebanonLesothoLiberiaLibyaLiechtensteinLithuaniaLow & middle incomeLow incomeLower middle incomeLuxembourgMacao SAR, ChinaMacedonia, FYRMadagascarMalawiMalaysiaMaldivesMaliMaltaMarshall IslandsMauritaniaMauritiusMexicoMicronesia, Fed. Sts.Middle East & North AfricaMiddle East & North Africa (excluding high income)Middle East & North Africa (IDA & IBRD countries)Middle incomeMoldovaMongoliaMontenegroMoroccoMozambiqueMyanmarNamibiaNepalNetherlandsNew CaledoniaNew ZealandNicaraguaNigerNigeriaNorth AmericaNorwayOECD membersOmanOther small statesPacific island small statesPakistanPalauPanamaPapua New GuineaParaguayPeruPhilippinesPolandPortugalPost-demographic dividendPre-demographic dividendPuerto RicoQatarRomaniaRussian FederationRwandaSamoaSan MarinoSao Tome and PrincipeSaudi ArabiaSenegalSerbiaSeychellesSierra LeoneSingaporeSint Maarten (Dutch part)Slovak RepublicSloveniaSmall statesSolomon IslandsSomaliaSouth AfricaSouth AsiaSouth Asia (IDA & IBRD)South SudanSpainSri LankaSt. Kitts and NevisSt. LuciaSt. Martin (French part)St. Vincent and the GrenadinesSub-Saharan Africa Sub-Saharan Africa (excluding high income)Sub-Saharan Africa (IDA & IBRD countries)SudanSurinameSwazilandSwedenSwitzerlandSyrian Arab RepublicTajikistanTanzaniaThailandTimor-LesteTogoTongaTrinidad and TobagoTunisiaTurkeyTurkmenistanUgandaUkraineUnited Arab EmiratesUnited KingdomUnited StatesUpper middle incomeUruguayUzbekistanVanuatuVenezuela, RBVietnamVirgin Islands (U.S.)West Bank and GazaWorldYemen, Rep.ZambiaZimbabwe Timeline:
This timeline shows a graph from 1961 to 2015 of Guinea. No data until 1960. Number of actual observations by date: 55.
Source name:
World Development Indicators
Source organization:
(1) United Nations Population Division. World Population Prospects, (2) Census reports and other statistical publications from national statistical offices, (3) Eurostat: Demographic Statistics, (4) United Nations Statistical Division. Population and Vital Statistics Reprot (various years), (5) U.S. Census Bureau: International Database, and (6) Secretariat of the Pacific Community: Statistics and Demography Programme.
Categories, topics:
Health, Gender, Social Development
Last updated:
apr 23, 2017
Indicators value changes by year
Minimum:
36.067
jan 1, 1961
Maximum:
59.219
jan 1, 2015
At the date of observation
Value
Absolute change
Change from previous value
jan 1, 1961
36.067
+36.067
0.0%
jan 1, 1962
36.252
+0.185
0.51%
jan 1, 1963
36.42
+0.168
0.46%
jan 1, 1964
36.573
+0.153
0.42%
jan 1, 1965
36.718
+0.145
0.4%
jan 1, 1966
36.861
+0.143
0.39%
jan 1, 1967
37.011
+0.15
0.41%
jan 1, 1968
37.175
+0.164
0.44%
jan 1, 1969
37.363
+0.188
0.51%
jan 1, 1970
37.583
+0.22
0.59%
jan 1, 1971
37.841
+0.258
0.69%
jan 1, 1972
38.141
+0.3
0.79%
jan 1, 1973
38.481
+0.34
0.89%
jan 1, 1974
38.859
+0.378
0.98%
jan 1, 1975
39.277
+0.418
1.08%
jan 1, 1976
39.732
+0.455
1.16%
jan 1, 1977
40.218
+0.486
1.22%
jan 1, 1978
40.733
+0.515
1.28%
jan 1, 1979
41.278
+0.545
1.34%
jan 1, 1980
41.857
+0.579
1.4%
jan 1, 1981
42.486
+0.629
1.5%
jan 1, 1982
43.186
+0.7
1.65%
jan 1, 1983
43.963
+0.777
1.8%
jan 1, 1984
44.814
+0.851
1.94%
jan 1, 1985
45.72
+0.906
2.02%
jan 1, 1986
46.663
+0.943
2.06%
jan 1, 1987
47.618
+0.955
2.05%
jan 1, 1988
48.552
+0.934
1.96%
jan 1, 1989
49.429
+0.877
1.81%
jan 1, 1990
50.22
+0.791
1.6%
jan 1, 1991
50.891
+0.671
1.34%
jan 1, 1992
51.416
+0.525
1.03%
jan 1, 1993
51.798
+0.382
0.74%
jan 1, 1994
52.047
+0.249
0.48%
jan 1, 1995
52.172
+0.125
0.24%
jan 1, 1996
52.175
+0.003
0.01%
jan 1, 1997
52.063
-0.112
-0.21%
jan 1, 1998
51.868
-0.195
-0.37%
jan 1, 1999
51.636
-0.232
-0.45%
jan 1, 2000
51.414
-0.222
-0.43%
jan 1, 2001
51.268
-0.146
-0.28%
jan 1, 2002
51.259
-0.009
-0.02%
jan 1, 2003
51.418
+0.159
0.31%
jan 1, 2004
51.755
+0.337
0.66%
jan 1, 2005
52.269
+0.514
0.99%
jan 1, 2006
52.939
+0.67
1.28%
jan 1, 2007
53.727
+0.788
1.49%
jan 1, 2008
54.567
+0.84
1.56%
jan 1, 2009
55.404
+0.837
1.53%
jan 1, 2010
56.201
+0.797
1.44%
jan 1, 2011
56.933
+0.732
1.3%
jan 1, 2012
57.587
+0.654
1.15%
jan 1, 2013
58.178
+0.591
1.03%
jan 1, 2014
58.721
+0.543
0.93%
jan 1, 2015
59.219
+0.498
0.85%
Ranking of countries by current statistics by years


Comments: