29
/
en
AIzaSyAYiBZKx7MnpbEhh9jyipgxe19OcubqV5w
April 1, 2024
205484
Namibia
NAM
true
2
1
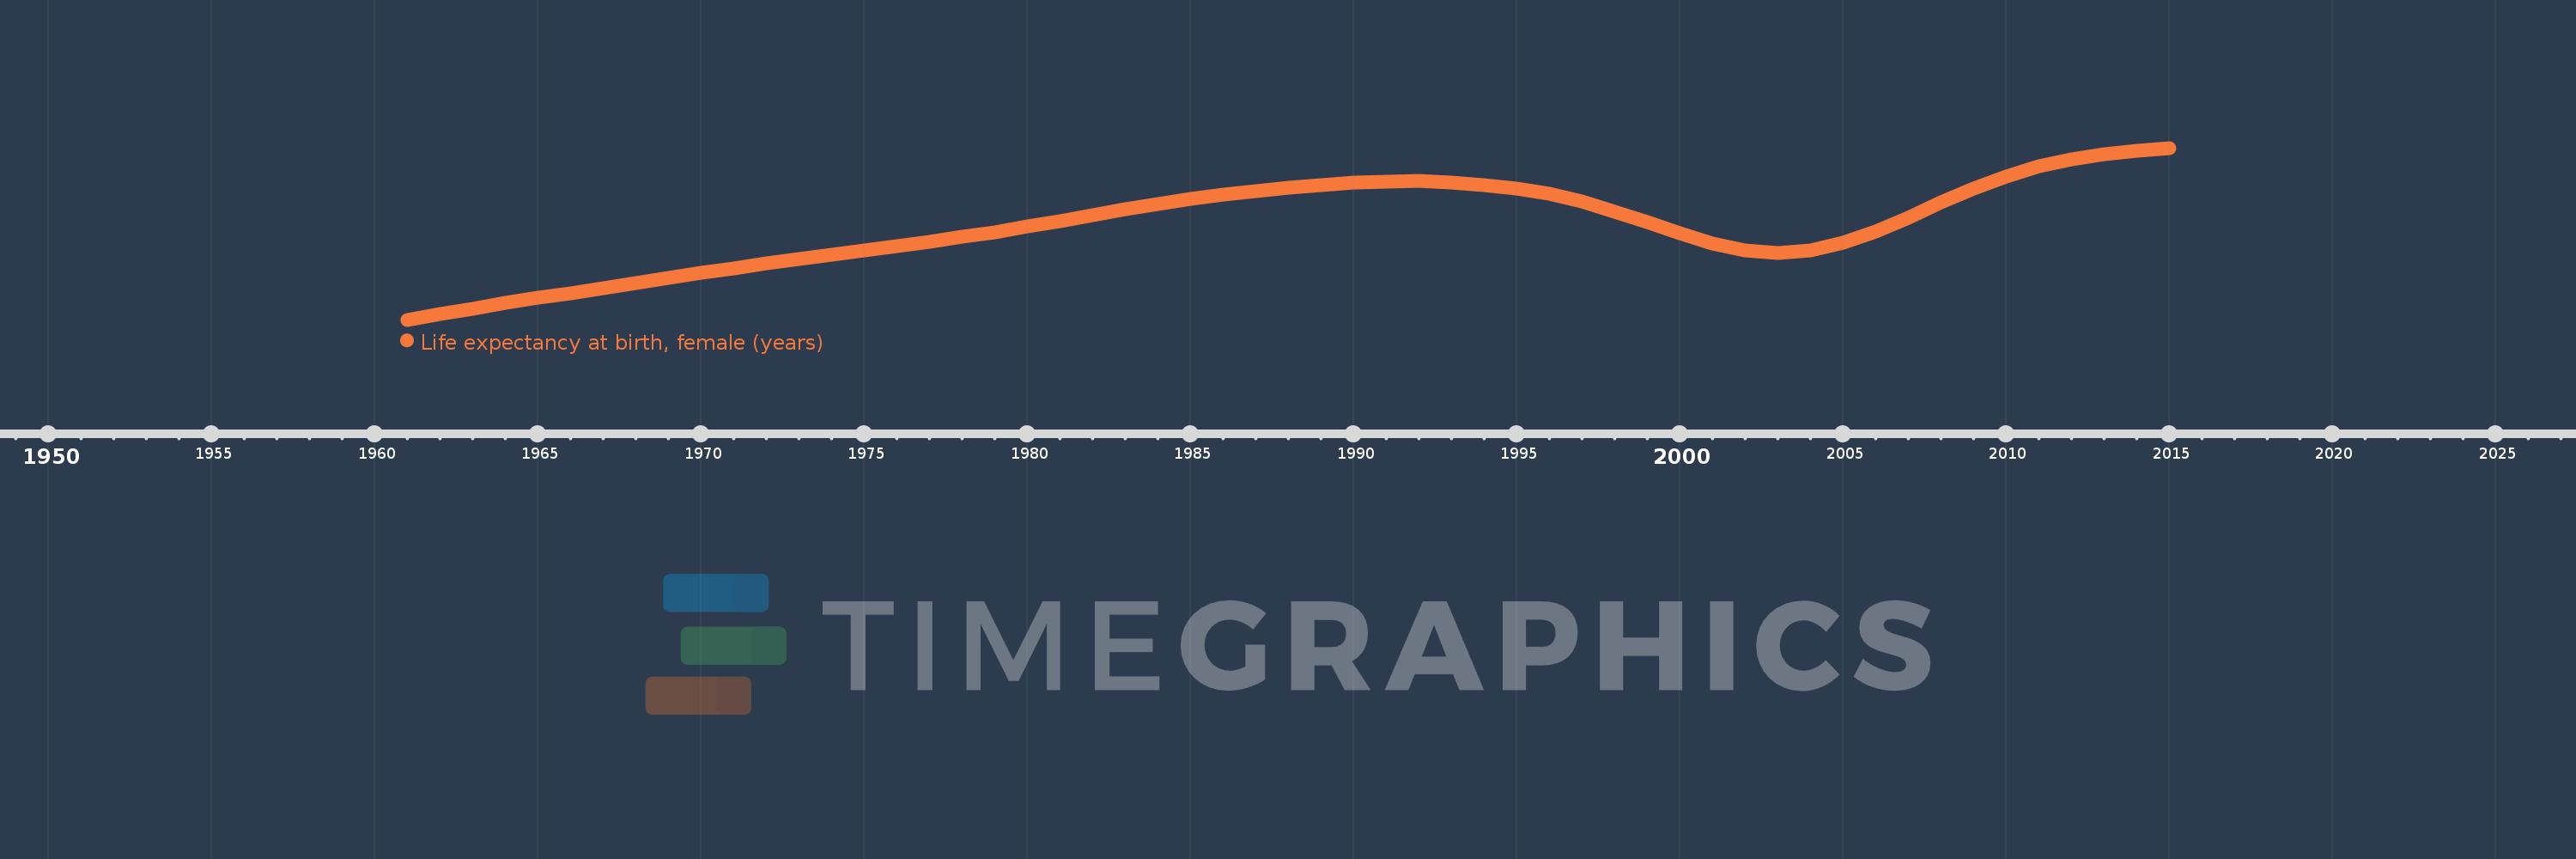
Life expectancy at birth, female (years)
2015,2014,2013,2012,2011,2010,2009,2008,2007,2006,2005,2004,2003,2002,2001,2000,1999,1998,1997,1996,1995,1994,1993,1992,1991,1990,1989,1988,1987,1986,1985,1984,1983,1982,1981,1980,1979,1978,1977,1976,1975,1974,1973,1972,1971,1970,1969,1968,1967,1966,1965,1964,1963,1962,1961
This statistics in other country:
AfghanistanAlbaniaAlgeriaAngolaAntigua and BarbudaArab WorldArgentinaArmeniaArubaAustraliaAustriaAzerbaijanBahamas, TheBahrainBangladeshBarbadosBelarusBelgiumBelizeBeninBermudaBhutanBoliviaBosnia and HerzegovinaBotswanaBrazilBrunei DarussalamBulgariaBurkina FasoBurundiCabo VerdeCambodiaCameroonCanadaCaribbean small statesCentral African RepublicCentral Europe and the BalticsChadChannel IslandsChileChinaColombiaComorosCongo, Dem. Rep.Congo, Rep.Costa RicaCote d'IvoireCroatiaCubaCuracaoCyprusCzech RepublicDenmarkDjiboutiDominicaDominican RepublicEarly-demographic dividendEast Asia & PacificEast Asia & Pacific (excluding high income)East Asia & Pacific (IDA & IBRD countries)EcuadorEgypt, Arab Rep.El SalvadorEquatorial GuineaEritreaEstoniaEthiopiaEuro areaEurope & Central AsiaEurope & Central Asia (excluding high income)Europe & Central Asia (IDA & IBRD countries)European UnionFaroe IslandsFijiFinlandFragile and conflict affected situationsFranceFrench PolynesiaGabonGambia, TheGeorgiaGermanyGhanaGreeceGreenlandGrenadaGuamGuatemalaGuineaGuinea-BissauGuyanaHaitiHeavily indebted poor countries (HIPC)High incomeHondurasHong Kong SAR, ChinaHungaryIBRD onlyIcelandIDA & IBRD totalIDA blendIDA onlyIDA totalIndiaIndonesiaIran, Islamic Rep.IraqIrelandIsle of ManIsraelItalyJamaicaJapanJordanKazakhstanKenyaKiribatiKorea, Dem. People’s Rep.Korea, Rep.KosovoKuwaitKyrgyz RepublicLao PDRLate-demographic dividendLatin America & Caribbean Latin America & Caribbean (excluding high income)Latin America & the Caribbean (IDA & IBRD countries)LatviaLeast developed countries: UN classificationLebanonLesothoLiberiaLibyaLiechtensteinLithuaniaLow & middle incomeLow incomeLower middle incomeLuxembourgMacao SAR, ChinaMacedonia, FYRMadagascarMalawiMalaysiaMaldivesMaliMaltaMarshall IslandsMauritaniaMauritiusMexicoMicronesia, Fed. Sts.Middle East & North AfricaMiddle East & North Africa (excluding high income)Middle East & North Africa (IDA & IBRD countries)Middle incomeMoldovaMongoliaMontenegroMoroccoMozambiqueMyanmarNamibiaNepalNetherlandsNew CaledoniaNew ZealandNicaraguaNigerNigeriaNorth AmericaNorwayOECD membersOmanOther small statesPacific island small statesPakistanPalauPanamaPapua New GuineaParaguayPeruPhilippinesPolandPortugalPost-demographic dividendPre-demographic dividendPuerto RicoQatarRomaniaRussian FederationRwandaSamoaSan MarinoSao Tome and PrincipeSaudi ArabiaSenegalSerbiaSeychellesSierra LeoneSingaporeSint Maarten (Dutch part)Slovak RepublicSloveniaSmall statesSolomon IslandsSomaliaSouth AfricaSouth AsiaSouth Asia (IDA & IBRD)South SudanSpainSri LankaSt. Kitts and NevisSt. LuciaSt. Martin (French part)St. Vincent and the GrenadinesSub-Saharan Africa Sub-Saharan Africa (excluding high income)Sub-Saharan Africa (IDA & IBRD countries)SudanSurinameSwazilandSwedenSwitzerlandSyrian Arab RepublicTajikistanTanzaniaThailandTimor-LesteTogoTongaTrinidad and TobagoTunisiaTurkeyTurkmenistanUgandaUkraineUnited Arab EmiratesUnited KingdomUnited StatesUpper middle incomeUruguayUzbekistanVanuatuVenezuela, RBVietnamVirgin Islands (U.S.)West Bank and GazaWorldYemen, Rep.ZambiaZimbabwe Timeline:
This timeline shows a graph from 1961 to 2015 of Namibia. No data until 1960. Number of actual observations by date: 55.
Source name:
World Development Indicators
Source organization:
(1) United Nations Population Division. World Population Prospects, (2) Census reports and other statistical publications from national statistical offices, (3) Eurostat: Demographic Statistics, (4) United Nations Statistical Division. Population and Vital Statistics Reprot (various years), (5) U.S. Census Bureau: International Database, and (6) Secretariat of the Pacific Community: Statistics and Demography Programme.
Categories, topics:
Health, Gender, Social Development
Last updated:
apr 23, 2017
Indicators value changes by year
Minimum:
49.111
jan 1, 1961
Maximum:
67.339
jan 1, 2015
At the date of observation
Value
Absolute change
Change from previous value
jan 1, 1961
49.111
+49.111
0.0%
jan 1, 1962
49.717
+0.606
1.23%
jan 1, 1963
50.302
+0.585
1.18%
jan 1, 1964
50.867
+0.565
1.12%
jan 1, 1965
51.414
+0.547
1.08%
jan 1, 1966
51.947
+0.533
1.04%
jan 1, 1967
52.474
+0.527
1.01%
jan 1, 1968
52.999
+0.525
1.0%
jan 1, 1969
53.526
+0.527
0.99%
jan 1, 1970
54.055
+0.529
0.99%
jan 1, 1971
54.578
+0.523
0.97%
jan 1, 1972
55.086
+0.508
0.93%
jan 1, 1973
55.572
+0.486
0.88%
jan 1, 1974
56.035
+0.463
0.83%
jan 1, 1975
56.481
+0.446
0.8%
jan 1, 1976
56.925
+0.444
0.79%
jan 1, 1977
57.389
+0.464
0.82%
jan 1, 1978
57.887
+0.498
0.87%
jan 1, 1979
58.423
+0.536
0.93%
jan 1, 1980
58.996
+0.573
0.98%
jan 1, 1981
59.596
+0.6
1.02%
jan 1, 1982
60.208
+0.612
1.03%
jan 1, 1983
60.809
+0.601
1.0%
jan 1, 1984
61.377
+0.568
0.93%
jan 1, 1985
61.895
+0.518
0.84%
jan 1, 1986
62.357
+0.462
0.75%
jan 1, 1987
62.766
+0.409
0.66%
jan 1, 1988
63.124
+0.358
0.57%
jan 1, 1989
63.425
+0.301
0.48%
jan 1, 1990
63.654
+0.229
0.36%
jan 1, 1991
63.789
+0.135
0.21%
jan 1, 1992
63.805
+0.016
0.03%
jan 1, 1993
63.689
-0.116
-0.18%
jan 1, 1994
63.432
-0.257
-0.4%
jan 1, 1995
63.033
-0.399
-0.63%
jan 1, 1996
62.448
-0.585
-0.93%
jan 1, 1997
61.63
-0.818
-1.31%
jan 1, 1998
60.604
-1.026
-1.66%
jan 1, 1999
59.442
-1.162
-1.92%
jan 1, 2000
58.246
-1.196
-2.01%
jan 1, 2001
57.191
-1.055
-1.81%
jan 1, 2002
56.476
-0.715
-1.25%
jan 1, 2003
56.222
-0.254
-0.45%
jan 1, 2004
56.485
+0.263
0.47%
jan 1, 2005
57.256
+0.771
1.36%
jan 1, 2006
58.458
+1.202
2.1%
jan 1, 2007
59.955
+1.497
2.56%
jan 1, 2008
61.54
+1.585
2.64%
jan 1, 2009
63.037
+1.497
2.43%
jan 1, 2010
64.343
+1.306
2.07%
jan 1, 2011
65.387
+1.044
1.62%
jan 1, 2012
66.147
+0.76
1.16%
jan 1, 2013
66.689
+0.542
0.82%
jan 1, 2014
67.079
+0.39
0.58%
jan 1, 2015
67.339
+0.26
0.39%
Ranking of countries by current statistics by years


Comments: