29
/
en
AIzaSyAYiBZKx7MnpbEhh9jyipgxe19OcubqV5w
April 1, 2024
105090
Chile
CHL
true
2
1
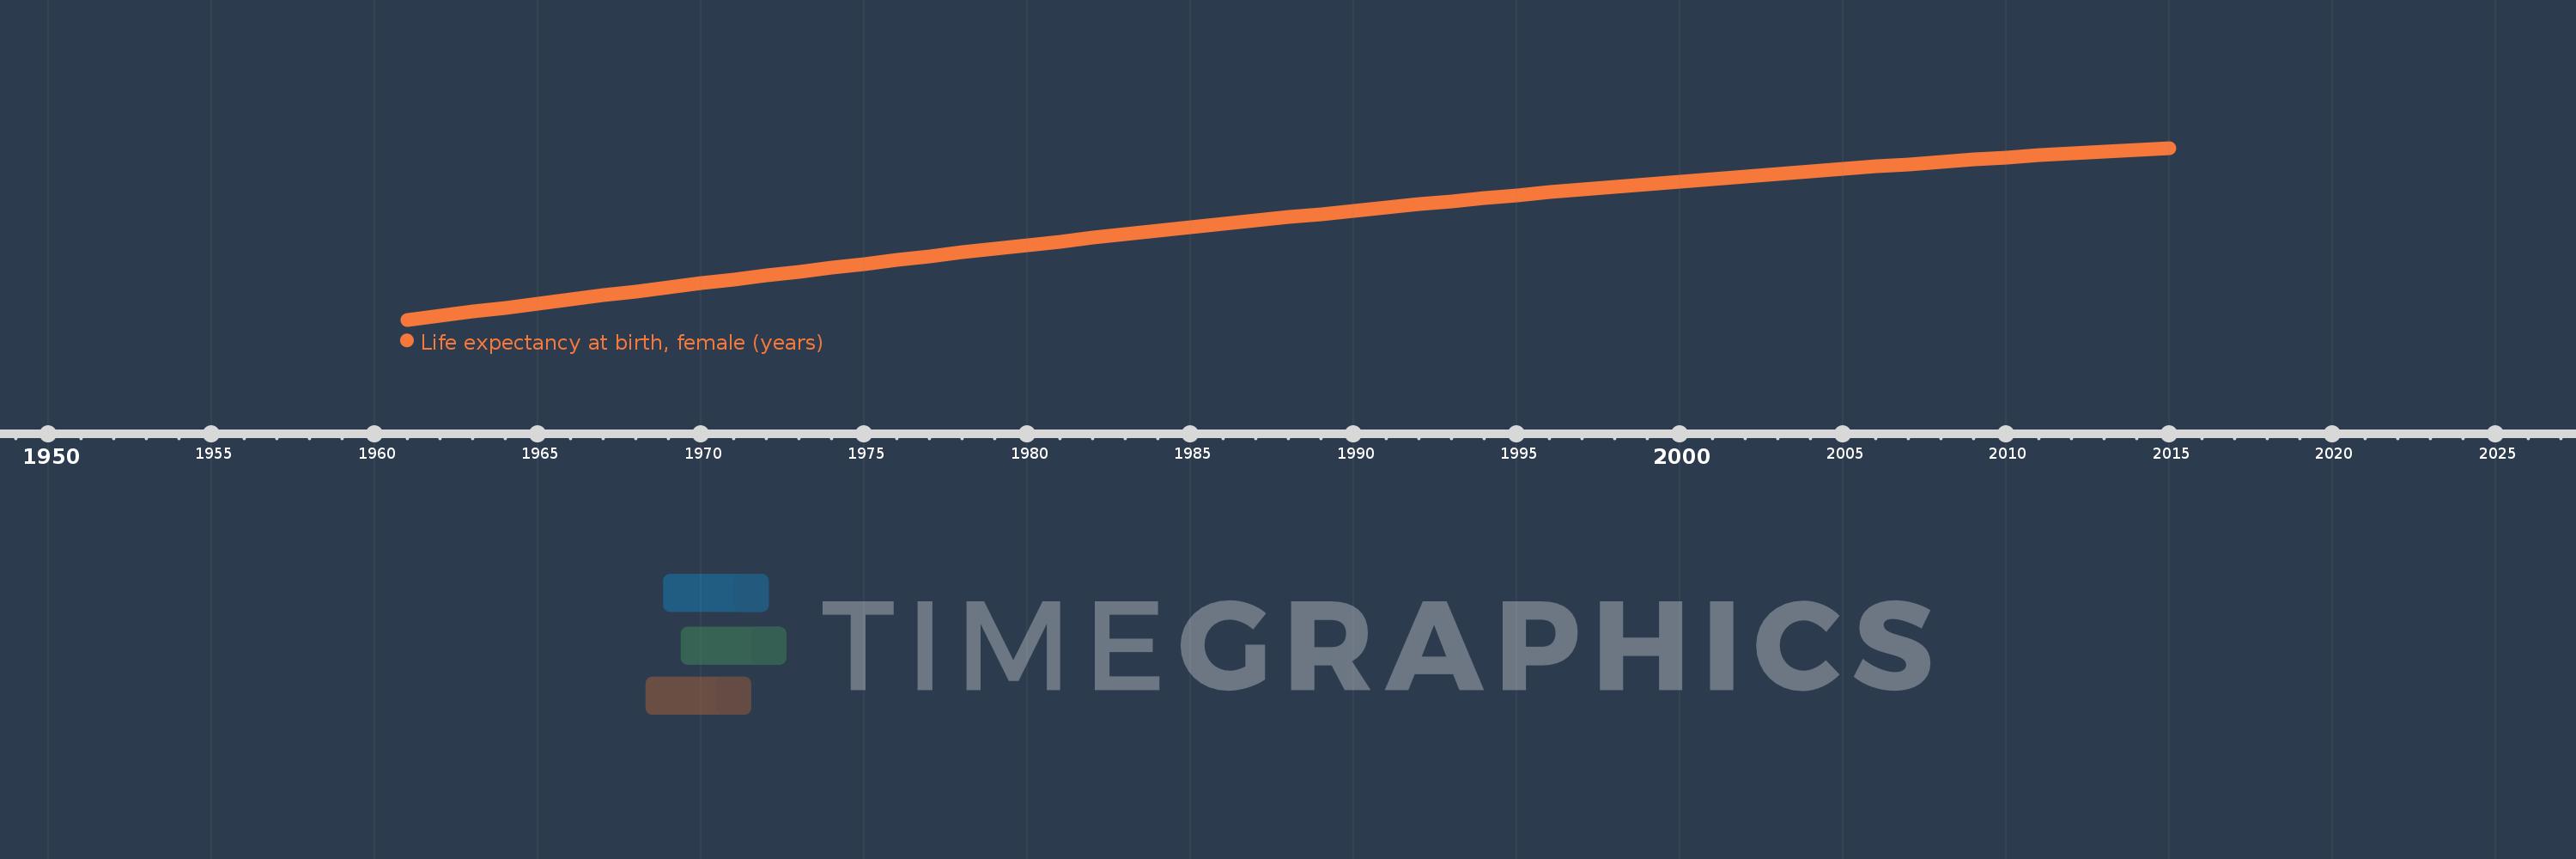
Life expectancy at birth, female (years)
2015,2014,2013,2012,2011,2010,2009,2008,2007,2006,2005,2004,2003,2002,2001,2000,1999,1998,1997,1996,1995,1994,1993,1992,1991,1990,1989,1988,1987,1986,1985,1984,1983,1982,1981,1980,1979,1978,1977,1976,1975,1974,1973,1972,1971,1970,1969,1968,1967,1966,1965,1964,1963,1962,1961
This statistics in other country:
AfghanistanAlbaniaAlgeriaAngolaAntigua and BarbudaArab WorldArgentinaArmeniaArubaAustraliaAustriaAzerbaijanBahamas, TheBahrainBangladeshBarbadosBelarusBelgiumBelizeBeninBermudaBhutanBoliviaBosnia and HerzegovinaBotswanaBrazilBrunei DarussalamBulgariaBurkina FasoBurundiCabo VerdeCambodiaCameroonCanadaCaribbean small statesCentral African RepublicCentral Europe and the BalticsChadChannel IslandsChileChinaColombiaComorosCongo, Dem. Rep.Congo, Rep.Costa RicaCote d'IvoireCroatiaCubaCuracaoCyprusCzech RepublicDenmarkDjiboutiDominicaDominican RepublicEarly-demographic dividendEast Asia & PacificEast Asia & Pacific (excluding high income)East Asia & Pacific (IDA & IBRD countries)EcuadorEgypt, Arab Rep.El SalvadorEquatorial GuineaEritreaEstoniaEthiopiaEuro areaEurope & Central AsiaEurope & Central Asia (excluding high income)Europe & Central Asia (IDA & IBRD countries)European UnionFaroe IslandsFijiFinlandFragile and conflict affected situationsFranceFrench PolynesiaGabonGambia, TheGeorgiaGermanyGhanaGreeceGreenlandGrenadaGuamGuatemalaGuineaGuinea-BissauGuyanaHaitiHeavily indebted poor countries (HIPC)High incomeHondurasHong Kong SAR, ChinaHungaryIBRD onlyIcelandIDA & IBRD totalIDA blendIDA onlyIDA totalIndiaIndonesiaIran, Islamic Rep.IraqIrelandIsle of ManIsraelItalyJamaicaJapanJordanKazakhstanKenyaKiribatiKorea, Dem. People’s Rep.Korea, Rep.KosovoKuwaitKyrgyz RepublicLao PDRLate-demographic dividendLatin America & Caribbean Latin America & Caribbean (excluding high income)Latin America & the Caribbean (IDA & IBRD countries)LatviaLeast developed countries: UN classificationLebanonLesothoLiberiaLibyaLiechtensteinLithuaniaLow & middle incomeLow incomeLower middle incomeLuxembourgMacao SAR, ChinaMacedonia, FYRMadagascarMalawiMalaysiaMaldivesMaliMaltaMarshall IslandsMauritaniaMauritiusMexicoMicronesia, Fed. Sts.Middle East & North AfricaMiddle East & North Africa (excluding high income)Middle East & North Africa (IDA & IBRD countries)Middle incomeMoldovaMongoliaMontenegroMoroccoMozambiqueMyanmarNamibiaNepalNetherlandsNew CaledoniaNew ZealandNicaraguaNigerNigeriaNorth AmericaNorwayOECD membersOmanOther small statesPacific island small statesPakistanPalauPanamaPapua New GuineaParaguayPeruPhilippinesPolandPortugalPost-demographic dividendPre-demographic dividendPuerto RicoQatarRomaniaRussian FederationRwandaSamoaSan MarinoSao Tome and PrincipeSaudi ArabiaSenegalSerbiaSeychellesSierra LeoneSingaporeSint Maarten (Dutch part)Slovak RepublicSloveniaSmall statesSolomon IslandsSomaliaSouth AfricaSouth AsiaSouth Asia (IDA & IBRD)South SudanSpainSri LankaSt. Kitts and NevisSt. LuciaSt. Martin (French part)St. Vincent and the GrenadinesSub-Saharan Africa Sub-Saharan Africa (excluding high income)Sub-Saharan Africa (IDA & IBRD countries)SudanSurinameSwazilandSwedenSwitzerlandSyrian Arab RepublicTajikistanTanzaniaThailandTimor-LesteTogoTongaTrinidad and TobagoTunisiaTurkeyTurkmenistanUgandaUkraineUnited Arab EmiratesUnited KingdomUnited StatesUpper middle incomeUruguayUzbekistanVanuatuVenezuela, RBVietnamVirgin Islands (U.S.)West Bank and GazaWorldYemen, Rep.ZambiaZimbabwe Timeline:
This timeline shows a graph from 1961 to 2015 of Chile. No data until 1960. Number of actual observations by date: 55.
Source name:
World Development Indicators
Source organization:
(1) United Nations Population Division. World Population Prospects, (2) Census reports and other statistical publications from national statistical offices, (3) Eurostat: Demographic Statistics, (4) United Nations Statistical Division. Population and Vital Statistics Reprot (various years), (5) U.S. Census Bureau: International Database, and (6) Secretariat of the Pacific Community: Statistics and Demography Programme.
Categories, topics:
Health, Gender, Social Development
Last updated:
apr 23, 2017
Indicators value changes by year
Maximum:
84.491
jan 1, 2015
At the date of observation
Value
Absolute change
Change from previous value
jan 1, 1961
60.26
+60.26
0.0%
jan 1, 1962
60.828
+0.568
0.94%
jan 1, 1963
61.397
+0.569
0.94%
jan 1, 1964
61.968
+0.571
0.93%
jan 1, 1965
62.538
+0.57
0.92%
jan 1, 1966
63.109
+0.571
0.91%
jan 1, 1967
63.679
+0.57
0.9%
jan 1, 1968
64.246
+0.567
0.89%
jan 1, 1969
64.812
+0.566
0.88%
jan 1, 1970
65.374
+0.562
0.87%
jan 1, 1971
65.933
+0.559
0.86%
jan 1, 1972
66.488
+0.555
0.84%
jan 1, 1973
67.04
+0.552
0.83%
jan 1, 1974
67.588
+0.548
0.82%
jan 1, 1975
68.133
+0.545
0.81%
jan 1, 1976
68.673
+0.54
0.79%
jan 1, 1977
69.209
+0.536
0.78%
jan 1, 1978
69.74
+0.531
0.77%
jan 1, 1979
70.265
+0.525
0.75%
jan 1, 1980
70.785
+0.52
0.74%
jan 1, 1981
71.298
+0.513
0.72%
jan 1, 1982
71.806
+0.508
0.71%
jan 1, 1983
72.307
+0.501
0.7%
jan 1, 1984
72.803
+0.496
0.69%
jan 1, 1985
73.293
+0.49
0.67%
jan 1, 1986
73.776
+0.483
0.66%
jan 1, 1987
74.253
+0.477
0.65%
jan 1, 1988
74.723
+0.47
0.63%
jan 1, 1989
75.186
+0.463
0.62%
jan 1, 1990
75.642
+0.456
0.61%
jan 1, 1991
76.09
+0.448
0.59%
jan 1, 1992
76.53
+0.44
0.58%
jan 1, 1993
76.963
+0.433
0.57%
jan 1, 1994
77.388
+0.425
0.55%
jan 1, 1995
77.806
+0.418
0.54%
jan 1, 1996
78.216
+0.41
0.53%
jan 1, 1997
78.618
+0.402
0.51%
jan 1, 1998
79.012
+0.394
0.5%
jan 1, 1999
79.398
+0.386
0.49%
jan 1, 2000
79.776
+0.378
0.48%
jan 1, 2001
80.146
+0.37
0.46%
jan 1, 2002
80.508
+0.362
0.45%
jan 1, 2003
80.863
+0.355
0.44%
jan 1, 2004
81.21
+0.347
0.43%
jan 1, 2005
81.549
+0.339
0.42%
jan 1, 2006
81.881
+0.332
0.41%
jan 1, 2007
82.206
+0.325
0.4%
jan 1, 2008
82.525
+0.319
0.39%
jan 1, 2009
82.837
+0.312
0.38%
jan 1, 2010
83.14
+0.303
0.37%
jan 1, 2011
83.434
+0.294
0.35%
jan 1, 2012
83.717
+0.283
0.34%
jan 1, 2013
83.988
+0.271
0.32%
jan 1, 2014
84.246
+0.258
0.31%
jan 1, 2015
84.491
+0.245
0.29%
Ranking of countries by current statistics by years


Comments: