29
/
en
AIzaSyAYiBZKx7MnpbEhh9jyipgxe19OcubqV5w
April 1, 2024
26674
Early-demographic dividend
EAR
false
2
1
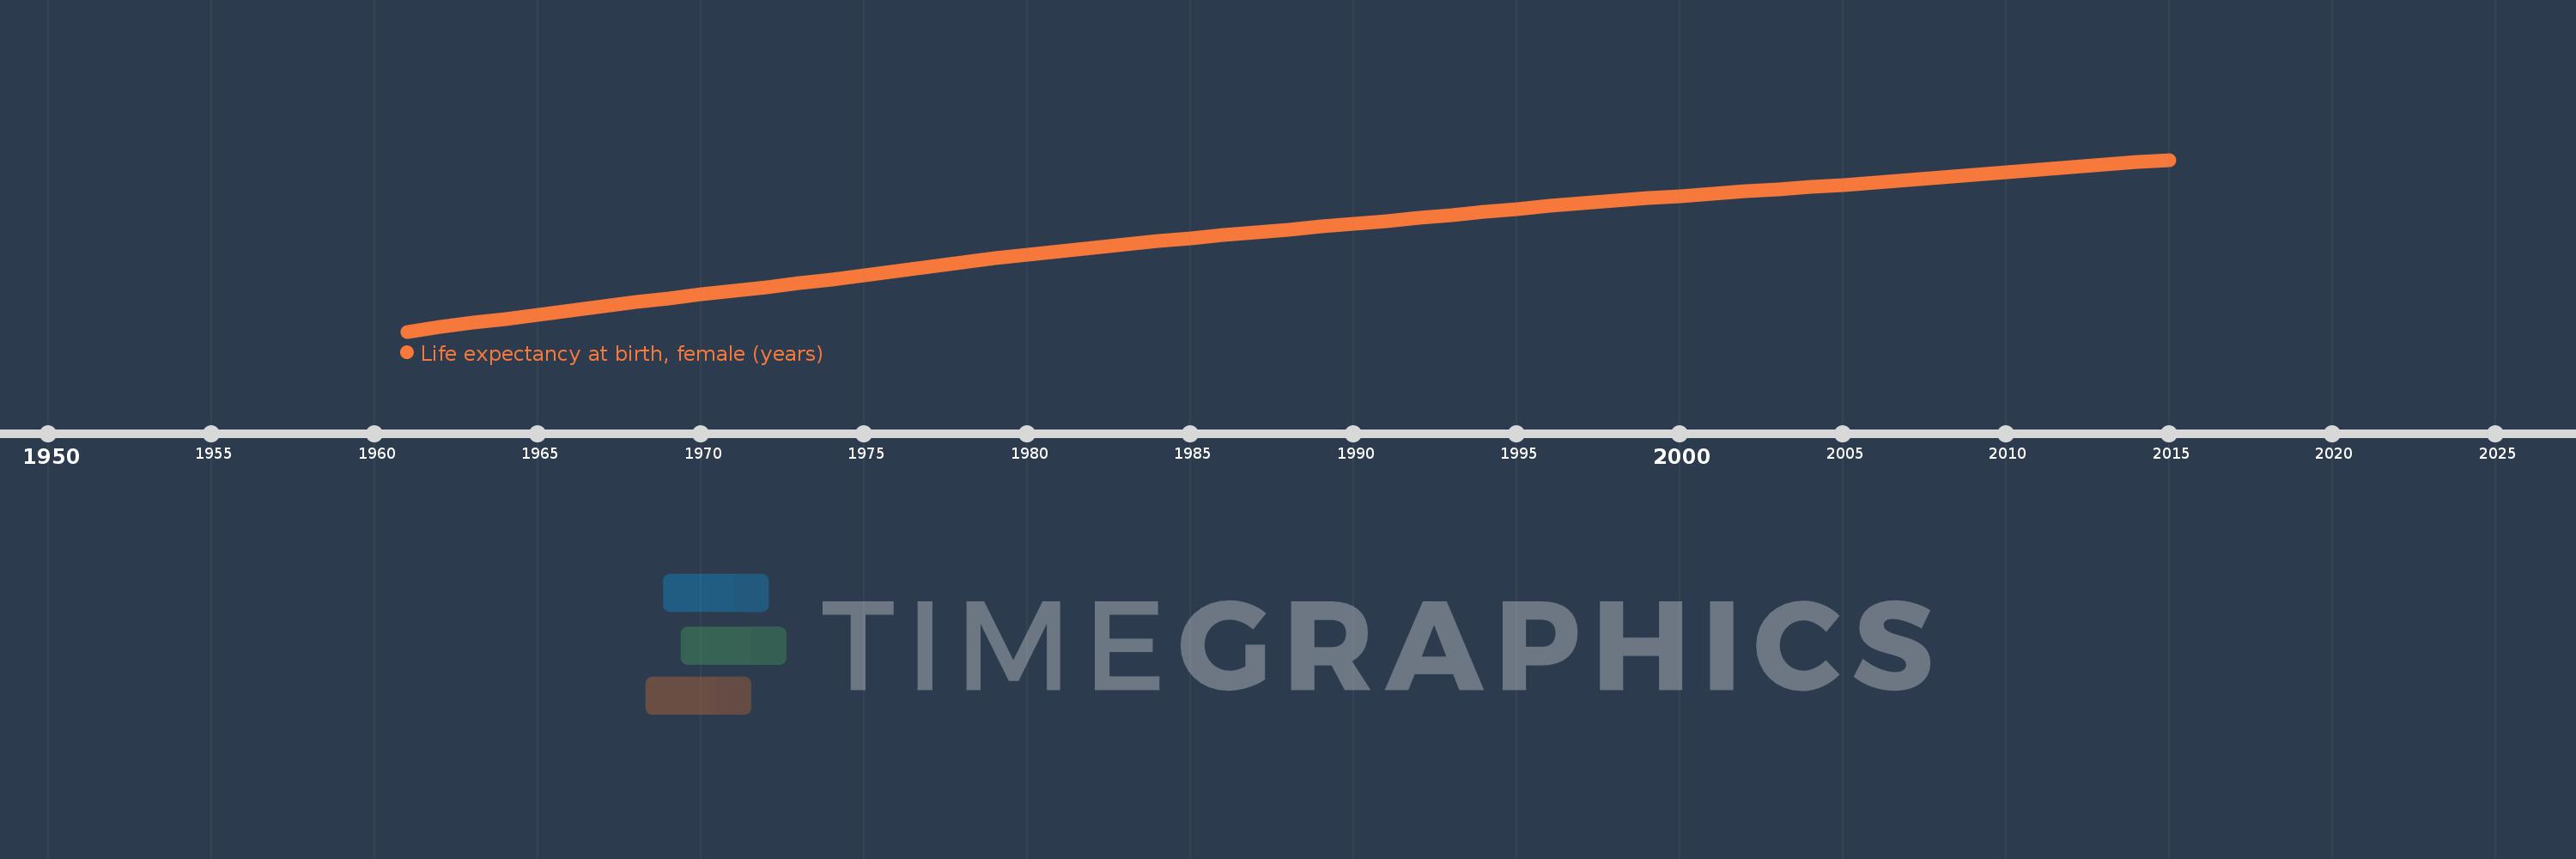
Life expectancy at birth, female (years)
2015,2014,2013,2012,2011,2010,2009,2008,2007,2006,2005,2004,2003,2002,2001,2000,1999,1998,1997,1996,1995,1994,1993,1992,1991,1990,1989,1988,1987,1986,1985,1984,1983,1982,1981,1980,1979,1978,1977,1976,1975,1974,1973,1972,1971,1970,1969,1968,1967,1966,1965,1964,1963,1962,1961
This statistics in other country:
AfghanistanAlbaniaAlgeriaAngolaAntigua and BarbudaArab WorldArgentinaArmeniaArubaAustraliaAustriaAzerbaijanBahamas, TheBahrainBangladeshBarbadosBelarusBelgiumBelizeBeninBermudaBhutanBoliviaBosnia and HerzegovinaBotswanaBrazilBrunei DarussalamBulgariaBurkina FasoBurundiCabo VerdeCambodiaCameroonCanadaCaribbean small statesCentral African RepublicCentral Europe and the BalticsChadChannel IslandsChileChinaColombiaComorosCongo, Dem. Rep.Congo, Rep.Costa RicaCote d'IvoireCroatiaCubaCuracaoCyprusCzech RepublicDenmarkDjiboutiDominicaDominican RepublicEarly-demographic dividendEast Asia & PacificEast Asia & Pacific (excluding high income)East Asia & Pacific (IDA & IBRD countries)EcuadorEgypt, Arab Rep.El SalvadorEquatorial GuineaEritreaEstoniaEthiopiaEuro areaEurope & Central AsiaEurope & Central Asia (excluding high income)Europe & Central Asia (IDA & IBRD countries)European UnionFaroe IslandsFijiFinlandFragile and conflict affected situationsFranceFrench PolynesiaGabonGambia, TheGeorgiaGermanyGhanaGreeceGreenlandGrenadaGuamGuatemalaGuineaGuinea-BissauGuyanaHaitiHeavily indebted poor countries (HIPC)High incomeHondurasHong Kong SAR, ChinaHungaryIBRD onlyIcelandIDA & IBRD totalIDA blendIDA onlyIDA totalIndiaIndonesiaIran, Islamic Rep.IraqIrelandIsle of ManIsraelItalyJamaicaJapanJordanKazakhstanKenyaKiribatiKorea, Dem. People’s Rep.Korea, Rep.KosovoKuwaitKyrgyz RepublicLao PDRLate-demographic dividendLatin America & Caribbean Latin America & Caribbean (excluding high income)Latin America & the Caribbean (IDA & IBRD countries)LatviaLeast developed countries: UN classificationLebanonLesothoLiberiaLibyaLiechtensteinLithuaniaLow & middle incomeLow incomeLower middle incomeLuxembourgMacao SAR, ChinaMacedonia, FYRMadagascarMalawiMalaysiaMaldivesMaliMaltaMarshall IslandsMauritaniaMauritiusMexicoMicronesia, Fed. Sts.Middle East & North AfricaMiddle East & North Africa (excluding high income)Middle East & North Africa (IDA & IBRD countries)Middle incomeMoldovaMongoliaMontenegroMoroccoMozambiqueMyanmarNamibiaNepalNetherlandsNew CaledoniaNew ZealandNicaraguaNigerNigeriaNorth AmericaNorwayOECD membersOmanOther small statesPacific island small statesPakistanPalauPanamaPapua New GuineaParaguayPeruPhilippinesPolandPortugalPost-demographic dividendPre-demographic dividendPuerto RicoQatarRomaniaRussian FederationRwandaSamoaSan MarinoSao Tome and PrincipeSaudi ArabiaSenegalSerbiaSeychellesSierra LeoneSingaporeSint Maarten (Dutch part)Slovak RepublicSloveniaSmall statesSolomon IslandsSomaliaSouth AfricaSouth AsiaSouth Asia (IDA & IBRD)South SudanSpainSri LankaSt. Kitts and NevisSt. LuciaSt. Martin (French part)St. Vincent and the GrenadinesSub-Saharan Africa Sub-Saharan Africa (excluding high income)Sub-Saharan Africa (IDA & IBRD countries)SudanSurinameSwazilandSwedenSwitzerlandSyrian Arab RepublicTajikistanTanzaniaThailandTimor-LesteTogoTongaTrinidad and TobagoTunisiaTurkeyTurkmenistanUgandaUkraineUnited Arab EmiratesUnited KingdomUnited StatesUpper middle incomeUruguayUzbekistanVanuatuVenezuela, RBVietnamVirgin Islands (U.S.)West Bank and GazaWorldYemen, Rep.ZambiaZimbabwe Timeline:
This timeline shows a graph from 1961 to 2015 of Early-demographic dividend. No data until 1960. Number of actual observations by date: 55.
Source name:
World Development Indicators
Source organization:
(1) United Nations Population Division. World Population Prospects, (2) Census reports and other statistical publications from national statistical offices, (3) Eurostat: Demographic Statistics, (4) United Nations Statistical Division. Population and Vital Statistics Reprot (various years), (5) U.S. Census Bureau: International Database, and (6) Secretariat of the Pacific Community: Statistics and Demography Programme.
Categories, topics:
Health, Gender, Social Development
Last updated:
apr 23, 2017
Indicators value changes by year
Minimum:
45.614
jan 1, 1961
Maximum:
70.956
jan 1, 2015
At the date of observation
Value
Absolute change
Change from previous value
jan 1, 1961
45.614
+45.614
0.0%
jan 1, 1962
46.296
+0.681
1.49%
jan 1, 1963
46.917
+0.621
1.34%
jan 1, 1964
47.476
+0.559
1.19%
jan 1, 1965
48.095
+0.619
1.3%
jan 1, 1966
48.708
+0.613
1.27%
jan 1, 1967
49.367
+0.659
1.35%
jan 1, 1968
49.952
+0.584
1.18%
jan 1, 1969
50.519
+0.567
1.13%
jan 1, 1970
51.072
+0.554
1.1%
jan 1, 1971
51.621
+0.549
1.07%
jan 1, 1972
52.176
+0.554
1.07%
jan 1, 1973
52.739
+0.563
1.08%
jan 1, 1974
53.326
+0.587
1.11%
jan 1, 1975
53.927
+0.601
1.13%
jan 1, 1976
54.542
+0.615
1.14%
jan 1, 1977
55.165
+0.623
1.14%
jan 1, 1978
55.782
+0.617
1.12%
jan 1, 1979
56.386
+0.603
1.08%
jan 1, 1980
56.965
+0.579
1.03%
jan 1, 1981
57.513
+0.549
0.96%
jan 1, 1982
58.028
+0.514
0.89%
jan 1, 1983
58.513
+0.485
0.84%
jan 1, 1984
58.977
+0.464
0.79%
jan 1, 1985
59.422
+0.445
0.75%
jan 1, 1986
59.854
+0.432
0.73%
jan 1, 1987
60.275
+0.421
0.7%
jan 1, 1988
60.691
+0.417
0.69%
jan 1, 1989
61.101
+0.41
0.68%
jan 1, 1990
61.525
+0.424
0.69%
jan 1, 1991
61.956
+0.431
0.7%
jan 1, 1992
62.39
+0.434
0.7%
jan 1, 1993
62.83
+0.44
0.71%
jan 1, 1994
63.273
+0.443
0.7%
jan 1, 1995
63.709
+0.437
0.69%
jan 1, 1996
64.133
+0.423
0.66%
jan 1, 1997
64.538
+0.405
0.63%
jan 1, 1998
64.922
+0.384
0.59%
jan 1, 1999
65.287
+0.365
0.56%
jan 1, 2000
65.633
+0.346
0.53%
jan 1, 2001
65.965
+0.332
0.51%
jan 1, 2002
66.287
+0.322
0.49%
jan 1, 2003
66.608
+0.321
0.48%
jan 1, 2004
66.935
+0.327
0.49%
jan 1, 2005
67.271
+0.336
0.5%
jan 1, 2006
67.619
+0.348
0.52%
jan 1, 2007
67.986
+0.367
0.54%
jan 1, 2008
68.366
+0.38
0.56%
jan 1, 2009
68.758
+0.392
0.57%
jan 1, 2010
69.153
+0.395
0.57%
jan 1, 2011
69.546
+0.393
0.57%
jan 1, 2012
69.927
+0.381
0.55%
jan 1, 2013
70.291
+0.364
0.52%
jan 1, 2014
70.635
+0.344
0.49%
jan 1, 2015
70.956
+0.321
0.45%
Ranking of countries by current statistics by years


Comments: