29
/
en
AIzaSyAYiBZKx7MnpbEhh9jyipgxe19OcubqV5w
April 1, 2024
45253
Low & middle income
LMY
false
2
1
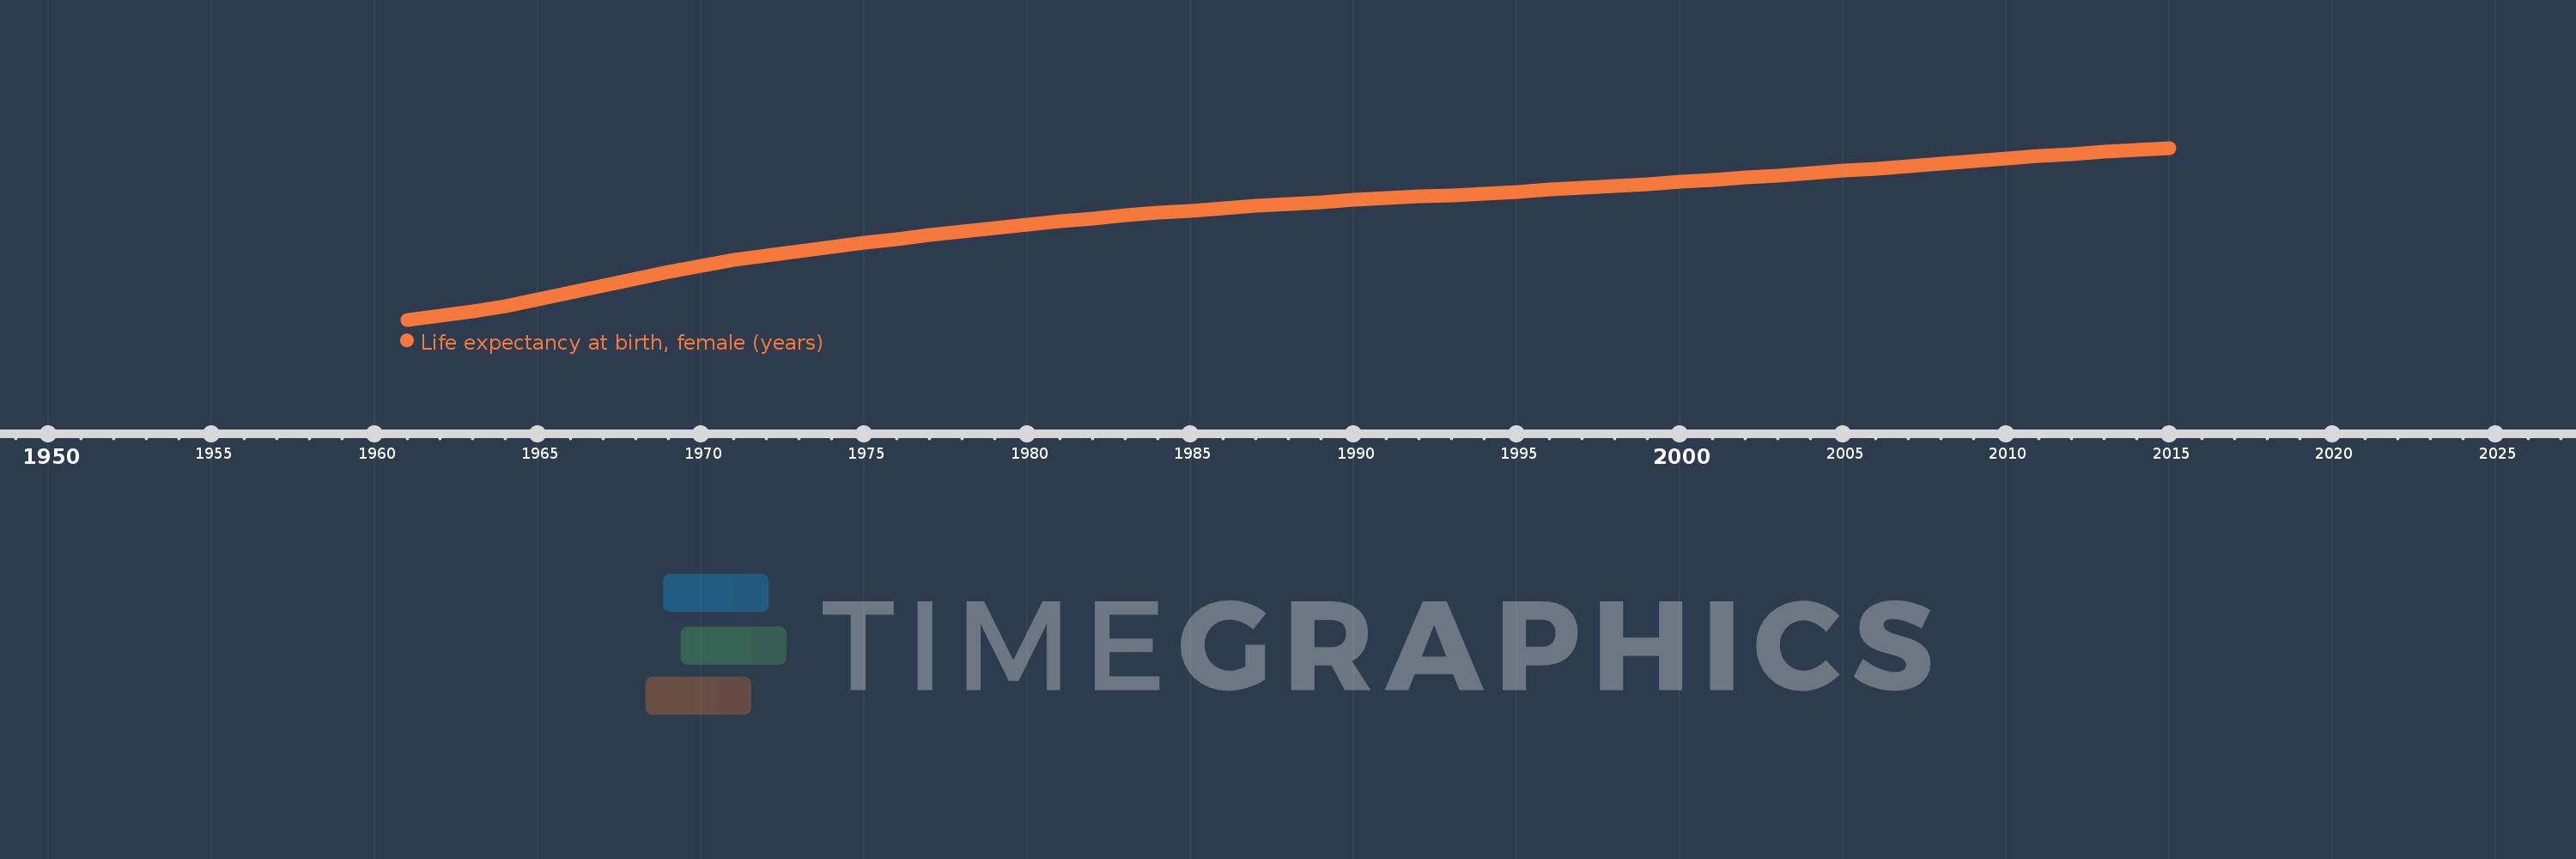
Life expectancy at birth, female (years)
2015,2014,2013,2012,2011,2010,2009,2008,2007,2006,2005,2004,2003,2002,2001,2000,1999,1998,1997,1996,1995,1994,1993,1992,1991,1990,1989,1988,1987,1986,1985,1984,1983,1982,1981,1980,1979,1978,1977,1976,1975,1974,1973,1972,1971,1970,1969,1968,1967,1966,1965,1964,1963,1962,1961
This statistics in other country:
AfghanistanAlbaniaAlgeriaAngolaAntigua and BarbudaArab WorldArgentinaArmeniaArubaAustraliaAustriaAzerbaijanBahamas, TheBahrainBangladeshBarbadosBelarusBelgiumBelizeBeninBermudaBhutanBoliviaBosnia and HerzegovinaBotswanaBrazilBrunei DarussalamBulgariaBurkina FasoBurundiCabo VerdeCambodiaCameroonCanadaCaribbean small statesCentral African RepublicCentral Europe and the BalticsChadChannel IslandsChileChinaColombiaComorosCongo, Dem. Rep.Congo, Rep.Costa RicaCote d'IvoireCroatiaCubaCuracaoCyprusCzech RepublicDenmarkDjiboutiDominicaDominican RepublicEarly-demographic dividendEast Asia & PacificEast Asia & Pacific (excluding high income)East Asia & Pacific (IDA & IBRD countries)EcuadorEgypt, Arab Rep.El SalvadorEquatorial GuineaEritreaEstoniaEthiopiaEuro areaEurope & Central AsiaEurope & Central Asia (excluding high income)Europe & Central Asia (IDA & IBRD countries)European UnionFaroe IslandsFijiFinlandFragile and conflict affected situationsFranceFrench PolynesiaGabonGambia, TheGeorgiaGermanyGhanaGreeceGreenlandGrenadaGuamGuatemalaGuineaGuinea-BissauGuyanaHaitiHeavily indebted poor countries (HIPC)High incomeHondurasHong Kong SAR, ChinaHungaryIBRD onlyIcelandIDA & IBRD totalIDA blendIDA onlyIDA totalIndiaIndonesiaIran, Islamic Rep.IraqIrelandIsle of ManIsraelItalyJamaicaJapanJordanKazakhstanKenyaKiribatiKorea, Dem. People’s Rep.Korea, Rep.KosovoKuwaitKyrgyz RepublicLao PDRLate-demographic dividendLatin America & Caribbean Latin America & Caribbean (excluding high income)Latin America & the Caribbean (IDA & IBRD countries)LatviaLeast developed countries: UN classificationLebanonLesothoLiberiaLibyaLiechtensteinLithuaniaLow & middle incomeLow incomeLower middle incomeLuxembourgMacao SAR, ChinaMacedonia, FYRMadagascarMalawiMalaysiaMaldivesMaliMaltaMarshall IslandsMauritaniaMauritiusMexicoMicronesia, Fed. Sts.Middle East & North AfricaMiddle East & North Africa (excluding high income)Middle East & North Africa (IDA & IBRD countries)Middle incomeMoldovaMongoliaMontenegroMoroccoMozambiqueMyanmarNamibiaNepalNetherlandsNew CaledoniaNew ZealandNicaraguaNigerNigeriaNorth AmericaNorwayOECD membersOmanOther small statesPacific island small statesPakistanPalauPanamaPapua New GuineaParaguayPeruPhilippinesPolandPortugalPost-demographic dividendPre-demographic dividendPuerto RicoQatarRomaniaRussian FederationRwandaSamoaSan MarinoSao Tome and PrincipeSaudi ArabiaSenegalSerbiaSeychellesSierra LeoneSingaporeSint Maarten (Dutch part)Slovak RepublicSloveniaSmall statesSolomon IslandsSomaliaSouth AfricaSouth AsiaSouth Asia (IDA & IBRD)South SudanSpainSri LankaSt. Kitts and NevisSt. LuciaSt. Martin (French part)St. Vincent and the GrenadinesSub-Saharan Africa Sub-Saharan Africa (excluding high income)Sub-Saharan Africa (IDA & IBRD countries)SudanSurinameSwazilandSwedenSwitzerlandSyrian Arab RepublicTajikistanTanzaniaThailandTimor-LesteTogoTongaTrinidad and TobagoTunisiaTurkeyTurkmenistanUgandaUkraineUnited Arab EmiratesUnited KingdomUnited StatesUpper middle incomeUruguayUzbekistanVanuatuVenezuela, RBVietnamVirgin Islands (U.S.)West Bank and GazaWorldYemen, Rep.ZambiaZimbabwe Timeline:
This timeline shows a graph from 1961 to 2015 of Low & middle income. No data until 1960. Number of actual observations by date: 55.
Source name:
World Development Indicators
Source organization:
(1) United Nations Population Division. World Population Prospects, (2) Census reports and other statistical publications from national statistical offices, (3) Eurostat: Demographic Statistics, (4) United Nations Statistical Division. Population and Vital Statistics Reprot (various years), (5) U.S. Census Bureau: International Database, and (6) Secretariat of the Pacific Community: Statistics and Demography Programme.
Categories, topics:
Health, Gender, Social Development
Last updated:
apr 23, 2017
Indicators value changes by year
Minimum:
48.658
jan 1, 1961
Maximum:
71.723
jan 1, 2015
At the date of observation
Value
Absolute change
Change from previous value
jan 1, 1961
48.658
+48.658
0.0%
jan 1, 1962
49.178
+0.521
1.07%
jan 1, 1963
49.787
+0.608
1.24%
jan 1, 1964
50.51
+0.724
1.45%
jan 1, 1965
51.359
+0.849
1.68%
jan 1, 1966
52.295
+0.936
1.82%
jan 1, 1967
53.264
+0.969
1.85%
jan 1, 1968
54.215
+0.95
1.78%
jan 1, 1969
55.103
+0.889
1.64%
jan 1, 1970
55.901
+0.797
1.45%
jan 1, 1971
56.64
+0.74
1.32%
jan 1, 1972
57.281
+0.641
1.13%
jan 1, 1973
57.85
+0.568
0.99%
jan 1, 1974
58.41
+0.56
0.97%
jan 1, 1975
58.97
+0.56
0.96%
jan 1, 1976
59.483
+0.513
0.87%
jan 1, 1977
60.004
+0.521
0.88%
jan 1, 1978
60.518
+0.514
0.86%
jan 1, 1979
61.0
+0.483
0.8%
jan 1, 1980
61.445
+0.445
0.73%
jan 1, 1981
61.873
+0.428
0.7%
jan 1, 1982
62.276
+0.403
0.65%
jan 1, 1983
62.658
+0.382
0.61%
jan 1, 1984
62.993
+0.334
0.53%
jan 1, 1985
63.292
+0.3
0.48%
jan 1, 1986
63.6
+0.307
0.49%
jan 1, 1987
63.922
+0.322
0.51%
jan 1, 1988
64.196
+0.275
0.43%
jan 1, 1989
64.462
+0.265
0.41%
jan 1, 1990
64.717
+0.255
0.4%
jan 1, 1991
64.964
+0.248
0.38%
jan 1, 1992
65.196
+0.232
0.36%
jan 1, 1993
65.365
+0.169
0.26%
jan 1, 1994
65.573
+0.208
0.32%
jan 1, 1995
65.829
+0.257
0.39%
jan 1, 1996
66.1
+0.271
0.41%
jan 1, 1997
66.366
+0.265
0.4%
jan 1, 1998
66.65
+0.284
0.43%
jan 1, 1999
66.89
+0.24
0.36%
jan 1, 2000
67.164
+0.274
0.41%
jan 1, 2001
67.44
+0.276
0.41%
jan 1, 2002
67.739
+0.299
0.44%
jan 1, 2003
68.019
+0.281
0.41%
jan 1, 2004
68.315
+0.296
0.44%
jan 1, 2005
68.638
+0.323
0.47%
jan 1, 2006
68.953
+0.315
0.46%
jan 1, 2007
69.297
+0.343
0.5%
jan 1, 2008
69.637
+0.34
0.49%
jan 1, 2009
69.96
+0.323
0.46%
jan 1, 2010
70.294
+0.335
0.48%
jan 1, 2011
70.605
+0.311
0.44%
jan 1, 2012
70.918
+0.313
0.44%
jan 1, 2013
71.205
+0.287
0.4%
jan 1, 2014
71.472
+0.267
0.37%
jan 1, 2015
71.723
+0.251
0.35%
Ranking of countries by current statistics by years


Comments: