29
/
en
AIzaSyAYiBZKx7MnpbEhh9jyipgxe19OcubqV5w
April 1, 2024
41620
Latin America & Caribbean
LCN
false
2
1
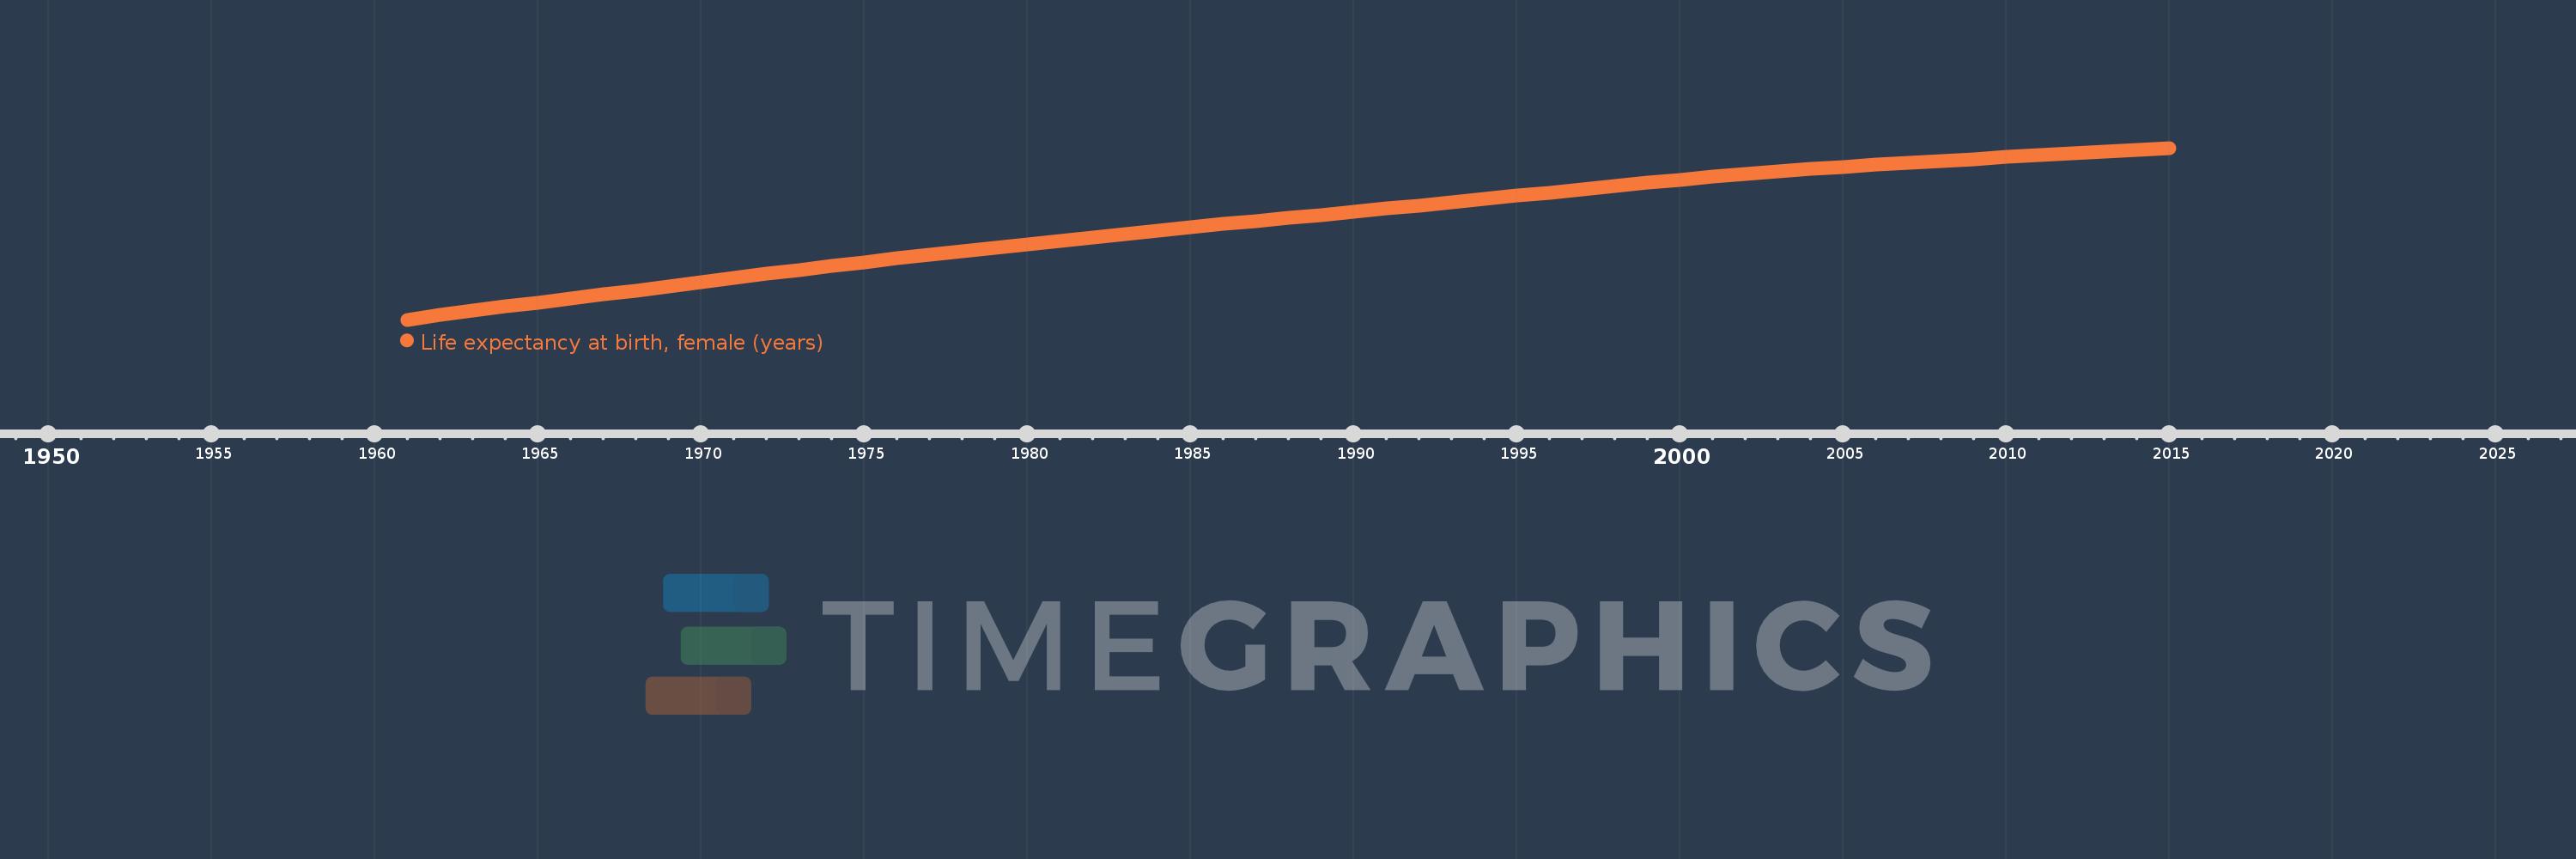
Life expectancy at birth, female (years)
2015,2014,2013,2012,2011,2010,2009,2008,2007,2006,2005,2004,2003,2002,2001,2000,1999,1998,1997,1996,1995,1994,1993,1992,1991,1990,1989,1988,1987,1986,1985,1984,1983,1982,1981,1980,1979,1978,1977,1976,1975,1974,1973,1972,1971,1970,1969,1968,1967,1966,1965,1964,1963,1962,1961
This statistics in other country:
AfghanistanAlbaniaAlgeriaAngolaAntigua and BarbudaArab WorldArgentinaArmeniaArubaAustraliaAustriaAzerbaijanBahamas, TheBahrainBangladeshBarbadosBelarusBelgiumBelizeBeninBermudaBhutanBoliviaBosnia and HerzegovinaBotswanaBrazilBrunei DarussalamBulgariaBurkina FasoBurundiCabo VerdeCambodiaCameroonCanadaCaribbean small statesCentral African RepublicCentral Europe and the BalticsChadChannel IslandsChileChinaColombiaComorosCongo, Dem. Rep.Congo, Rep.Costa RicaCote d'IvoireCroatiaCubaCuracaoCyprusCzech RepublicDenmarkDjiboutiDominicaDominican RepublicEarly-demographic dividendEast Asia & PacificEast Asia & Pacific (excluding high income)East Asia & Pacific (IDA & IBRD countries)EcuadorEgypt, Arab Rep.El SalvadorEquatorial GuineaEritreaEstoniaEthiopiaEuro areaEurope & Central AsiaEurope & Central Asia (excluding high income)Europe & Central Asia (IDA & IBRD countries)European UnionFaroe IslandsFijiFinlandFragile and conflict affected situationsFranceFrench PolynesiaGabonGambia, TheGeorgiaGermanyGhanaGreeceGreenlandGrenadaGuamGuatemalaGuineaGuinea-BissauGuyanaHaitiHeavily indebted poor countries (HIPC)High incomeHondurasHong Kong SAR, ChinaHungaryIBRD onlyIcelandIDA & IBRD totalIDA blendIDA onlyIDA totalIndiaIndonesiaIran, Islamic Rep.IraqIrelandIsle of ManIsraelItalyJamaicaJapanJordanKazakhstanKenyaKiribatiKorea, Dem. People’s Rep.Korea, Rep.KosovoKuwaitKyrgyz RepublicLao PDRLate-demographic dividendLatin America & Caribbean Latin America & Caribbean (excluding high income)Latin America & the Caribbean (IDA & IBRD countries)LatviaLeast developed countries: UN classificationLebanonLesothoLiberiaLibyaLiechtensteinLithuaniaLow & middle incomeLow incomeLower middle incomeLuxembourgMacao SAR, ChinaMacedonia, FYRMadagascarMalawiMalaysiaMaldivesMaliMaltaMarshall IslandsMauritaniaMauritiusMexicoMicronesia, Fed. Sts.Middle East & North AfricaMiddle East & North Africa (excluding high income)Middle East & North Africa (IDA & IBRD countries)Middle incomeMoldovaMongoliaMontenegroMoroccoMozambiqueMyanmarNamibiaNepalNetherlandsNew CaledoniaNew ZealandNicaraguaNigerNigeriaNorth AmericaNorwayOECD membersOmanOther small statesPacific island small statesPakistanPalauPanamaPapua New GuineaParaguayPeruPhilippinesPolandPortugalPost-demographic dividendPre-demographic dividendPuerto RicoQatarRomaniaRussian FederationRwandaSamoaSan MarinoSao Tome and PrincipeSaudi ArabiaSenegalSerbiaSeychellesSierra LeoneSingaporeSint Maarten (Dutch part)Slovak RepublicSloveniaSmall statesSolomon IslandsSomaliaSouth AfricaSouth AsiaSouth Asia (IDA & IBRD)South SudanSpainSri LankaSt. Kitts and NevisSt. LuciaSt. Martin (French part)St. Vincent and the GrenadinesSub-Saharan Africa Sub-Saharan Africa (excluding high income)Sub-Saharan Africa (IDA & IBRD countries)SudanSurinameSwazilandSwedenSwitzerlandSyrian Arab RepublicTajikistanTanzaniaThailandTimor-LesteTogoTongaTrinidad and TobagoTunisiaTurkeyTurkmenistanUgandaUkraineUnited Arab EmiratesUnited KingdomUnited StatesUpper middle incomeUruguayUzbekistanVanuatuVenezuela, RBVietnamVirgin Islands (U.S.)West Bank and GazaWorldYemen, Rep.ZambiaZimbabwe Timeline:
This timeline shows a graph from 1961 to 2015 of Latin America & Caribbean . No data until 1960. Number of actual observations by date: 55.
Source name:
World Development Indicators
Source organization:
(1) United Nations Population Division. World Population Prospects, (2) Census reports and other statistical publications from national statistical offices, (3) Eurostat: Demographic Statistics, (4) United Nations Statistical Division. Population and Vital Statistics Reprot (various years), (5) U.S. Census Bureau: International Database, and (6) Secretariat of the Pacific Community: Statistics and Demography Programme.
Categories, topics:
Health, Gender, Social Development
Last updated:
apr 23, 2017
Indicators value changes by year
Maximum:
78.263
jan 1, 2015
At the date of observation
Value
Absolute change
Change from previous value
jan 1, 1961
57.98
+57.98
0.0%
jan 1, 1962
58.512
+0.532
0.92%
jan 1, 1963
59.028
+0.516
0.88%
jan 1, 1964
59.528
+0.5
0.85%
jan 1, 1965
60.014
+0.486
0.82%
jan 1, 1966
60.492
+0.477
0.79%
jan 1, 1967
60.966
+0.474
0.78%
jan 1, 1968
61.443
+0.477
0.78%
jan 1, 1969
61.926
+0.483
0.79%
jan 1, 1970
62.416
+0.49
0.79%
jan 1, 1971
62.909
+0.493
0.79%
jan 1, 1972
63.399
+0.49
0.78%
jan 1, 1973
63.878
+0.479
0.76%
jan 1, 1974
64.342
+0.464
0.73%
jan 1, 1975
64.789
+0.447
0.69%
jan 1, 1976
65.22
+0.431
0.67%
jan 1, 1977
65.641
+0.421
0.65%
jan 1, 1978
66.057
+0.416
0.63%
jan 1, 1979
66.473
+0.416
0.63%
jan 1, 1980
66.889
+0.416
0.63%
jan 1, 1981
67.305
+0.416
0.62%
jan 1, 1982
67.717
+0.412
0.61%
jan 1, 1983
68.122
+0.405
0.6%
jan 1, 1984
68.517
+0.395
0.58%
jan 1, 1985
68.902
+0.385
0.56%
jan 1, 1986
69.278
+0.376
0.55%
jan 1, 1987
69.646
+0.368
0.53%
jan 1, 1988
70.01
+0.363
0.52%
jan 1, 1989
70.371
+0.361
0.52%
jan 1, 1990
70.733
+0.362
0.51%
jan 1, 1991
71.098
+0.365
0.52%
jan 1, 1992
71.469
+0.371
0.52%
jan 1, 1993
71.846
+0.377
0.53%
jan 1, 1994
72.228
+0.382
0.53%
jan 1, 1995
72.613
+0.385
0.53%
jan 1, 1996
73.0
+0.387
0.53%
jan 1, 1997
73.388
+0.387
0.53%
jan 1, 1998
73.77
+0.383
0.52%
jan 1, 1999
74.145
+0.375
0.51%
jan 1, 2000
74.508
+0.363
0.49%
jan 1, 2001
74.858
+0.351
0.47%
jan 1, 2002
75.186
+0.327
0.44%
jan 1, 2003
75.494
+0.308
0.41%
jan 1, 2004
75.777
+0.283
0.37%
jan 1, 2005
76.041
+0.264
0.35%
jan 1, 2006
76.288
+0.247
0.33%
jan 1, 2007
76.523
+0.234
0.31%
jan 1, 2008
76.747
+0.224
0.29%
jan 1, 2009
76.962
+0.215
0.28%
jan 1, 2010
77.181
+0.219
0.28%
jan 1, 2011
77.399
+0.218
0.28%
jan 1, 2012
77.618
+0.219
0.28%
jan 1, 2013
77.835
+0.217
0.28%
jan 1, 2014
78.05
+0.215
0.28%
jan 1, 2015
78.263
+0.213
0.27%
Ranking of countries by current statistics by years


Comments: