29
/
en
AIzaSyAYiBZKx7MnpbEhh9jyipgxe19OcubqV5w
April 1, 2024
115965
Cuba
CUB
true
2
1
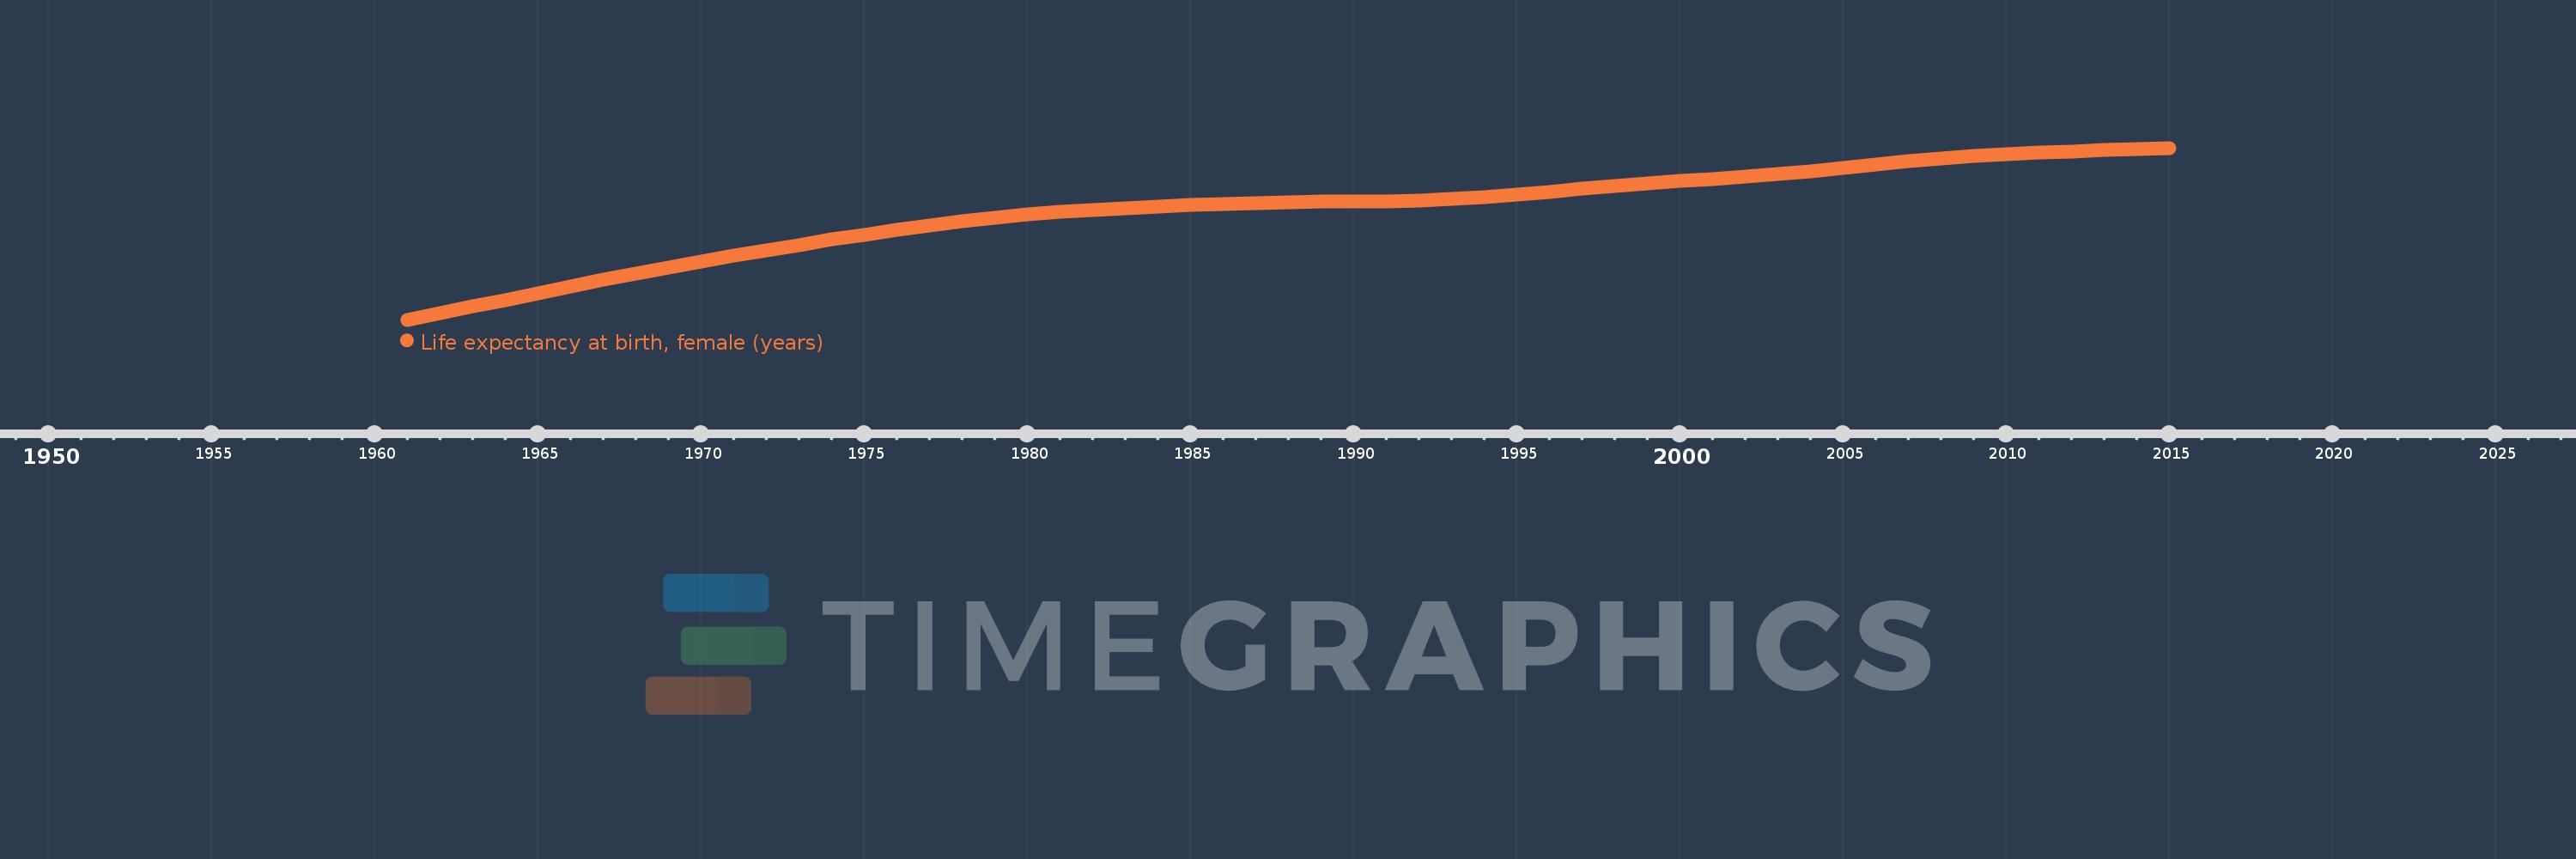
Life expectancy at birth, female (years)
2015,2014,2013,2012,2011,2010,2009,2008,2007,2006,2005,2004,2003,2002,2001,2000,1999,1998,1997,1996,1995,1994,1993,1992,1991,1990,1989,1988,1987,1986,1985,1984,1983,1982,1981,1980,1979,1978,1977,1976,1975,1974,1973,1972,1971,1970,1969,1968,1967,1966,1965,1964,1963,1962,1961
This statistics in other country:
AfghanistanAlbaniaAlgeriaAngolaAntigua and BarbudaArab WorldArgentinaArmeniaArubaAustraliaAustriaAzerbaijanBahamas, TheBahrainBangladeshBarbadosBelarusBelgiumBelizeBeninBermudaBhutanBoliviaBosnia and HerzegovinaBotswanaBrazilBrunei DarussalamBulgariaBurkina FasoBurundiCabo VerdeCambodiaCameroonCanadaCaribbean small statesCentral African RepublicCentral Europe and the BalticsChadChannel IslandsChileChinaColombiaComorosCongo, Dem. Rep.Congo, Rep.Costa RicaCote d'IvoireCroatiaCubaCuracaoCyprusCzech RepublicDenmarkDjiboutiDominicaDominican RepublicEarly-demographic dividendEast Asia & PacificEast Asia & Pacific (excluding high income)East Asia & Pacific (IDA & IBRD countries)EcuadorEgypt, Arab Rep.El SalvadorEquatorial GuineaEritreaEstoniaEthiopiaEuro areaEurope & Central AsiaEurope & Central Asia (excluding high income)Europe & Central Asia (IDA & IBRD countries)European UnionFaroe IslandsFijiFinlandFragile and conflict affected situationsFranceFrench PolynesiaGabonGambia, TheGeorgiaGermanyGhanaGreeceGreenlandGrenadaGuamGuatemalaGuineaGuinea-BissauGuyanaHaitiHeavily indebted poor countries (HIPC)High incomeHondurasHong Kong SAR, ChinaHungaryIBRD onlyIcelandIDA & IBRD totalIDA blendIDA onlyIDA totalIndiaIndonesiaIran, Islamic Rep.IraqIrelandIsle of ManIsraelItalyJamaicaJapanJordanKazakhstanKenyaKiribatiKorea, Dem. People’s Rep.Korea, Rep.KosovoKuwaitKyrgyz RepublicLao PDRLate-demographic dividendLatin America & Caribbean Latin America & Caribbean (excluding high income)Latin America & the Caribbean (IDA & IBRD countries)LatviaLeast developed countries: UN classificationLebanonLesothoLiberiaLibyaLiechtensteinLithuaniaLow & middle incomeLow incomeLower middle incomeLuxembourgMacao SAR, ChinaMacedonia, FYRMadagascarMalawiMalaysiaMaldivesMaliMaltaMarshall IslandsMauritaniaMauritiusMexicoMicronesia, Fed. Sts.Middle East & North AfricaMiddle East & North Africa (excluding high income)Middle East & North Africa (IDA & IBRD countries)Middle incomeMoldovaMongoliaMontenegroMoroccoMozambiqueMyanmarNamibiaNepalNetherlandsNew CaledoniaNew ZealandNicaraguaNigerNigeriaNorth AmericaNorwayOECD membersOmanOther small statesPacific island small statesPakistanPalauPanamaPapua New GuineaParaguayPeruPhilippinesPolandPortugalPost-demographic dividendPre-demographic dividendPuerto RicoQatarRomaniaRussian FederationRwandaSamoaSan MarinoSao Tome and PrincipeSaudi ArabiaSenegalSerbiaSeychellesSierra LeoneSingaporeSint Maarten (Dutch part)Slovak RepublicSloveniaSmall statesSolomon IslandsSomaliaSouth AfricaSouth AsiaSouth Asia (IDA & IBRD)South SudanSpainSri LankaSt. Kitts and NevisSt. LuciaSt. Martin (French part)St. Vincent and the GrenadinesSub-Saharan Africa Sub-Saharan Africa (excluding high income)Sub-Saharan Africa (IDA & IBRD countries)SudanSurinameSwazilandSwedenSwitzerlandSyrian Arab RepublicTajikistanTanzaniaThailandTimor-LesteTogoTongaTrinidad and TobagoTunisiaTurkeyTurkmenistanUgandaUkraineUnited Arab EmiratesUnited KingdomUnited StatesUpper middle incomeUruguayUzbekistanVanuatuVenezuela, RBVietnamVirgin Islands (U.S.)West Bank and GazaWorldYemen, Rep.ZambiaZimbabwe Timeline:
This timeline shows a graph from 1961 to 2015 of Cuba. No data until 1960. Number of actual observations by date: 55.
Source name:
World Development Indicators
Source organization:
(1) United Nations Population Division. World Population Prospects, (2) Census reports and other statistical publications from national statistical offices, (3) Eurostat: Demographic Statistics, (4) United Nations Statistical Division. Population and Vital Statistics Reprot (various years), (5) U.S. Census Bureau: International Database, and (6) Secretariat of the Pacific Community: Statistics and Demography Programme.
Categories, topics:
Health, Gender, Social Development
Last updated:
apr 23, 2017
Indicators value changes by year
Maximum:
81.498
jan 1, 2015
At the date of observation
Value
Absolute change
Change from previous value
jan 1, 1961
65.62
+65.62
0.0%
jan 1, 1962
66.22
+0.6
0.91%
jan 1, 1963
66.83
+0.61
0.92%
jan 1, 1964
67.447
+0.617
0.92%
jan 1, 1965
68.069
+0.622
0.92%
jan 1, 1966
68.688
+0.619
0.91%
jan 1, 1967
69.298
+0.61
0.89%
jan 1, 1968
69.892
+0.594
0.86%
jan 1, 1969
70.464
+0.572
0.82%
jan 1, 1970
71.012
+0.548
0.78%
jan 1, 1971
71.538
+0.526
0.74%
jan 1, 1972
72.046
+0.508
0.71%
jan 1, 1973
72.541
+0.495
0.69%
jan 1, 1974
73.024
+0.483
0.67%
jan 1, 1975
73.492
+0.468
0.64%
jan 1, 1976
73.936
+0.444
0.6%
jan 1, 1977
74.348
+0.412
0.56%
jan 1, 1978
74.719
+0.371
0.5%
jan 1, 1979
75.046
+0.327
0.44%
jan 1, 1980
75.326
+0.28
0.37%
jan 1, 1981
75.564
+0.238
0.32%
jan 1, 1982
75.764
+0.2
0.26%
jan 1, 1983
75.935
+0.171
0.23%
jan 1, 1984
76.087
+0.152
0.2%
jan 1, 1985
76.222
+0.135
0.18%
jan 1, 1986
76.338
+0.116
0.15%
jan 1, 1987
76.428
+0.09
0.12%
jan 1, 1988
76.489
+0.061
0.08%
jan 1, 1989
76.527
+0.038
0.05%
jan 1, 1990
76.551
+0.024
0.03%
jan 1, 1991
76.584
+0.033
0.04%
jan 1, 1992
76.651
+0.067
0.09%
jan 1, 1993
76.765
+0.114
0.15%
jan 1, 1994
76.936
+0.171
0.22%
jan 1, 1995
77.16
+0.224
0.29%
jan 1, 1996
77.425
+0.265
0.34%
jan 1, 1997
77.707
+0.282
0.36%
jan 1, 1998
77.98
+0.273
0.35%
jan 1, 1999
78.227
+0.247
0.32%
jan 1, 2000
78.447
+0.22
0.28%
jan 1, 2001
78.648
+0.201
0.26%
jan 1, 2002
78.851
+0.203
0.26%
jan 1, 2003
79.078
+0.227
0.29%
jan 1, 2004
79.34
+0.262
0.33%
jan 1, 2005
79.632
+0.292
0.37%
jan 1, 2006
79.942
+0.31
0.39%
jan 1, 2007
80.245
+0.303
0.38%
jan 1, 2008
80.52
+0.275
0.34%
jan 1, 2009
80.75
+0.23
0.29%
jan 1, 2010
80.933
+0.183
0.23%
jan 1, 2011
81.072
+0.139
0.17%
jan 1, 2012
81.181
+0.109
0.13%
jan 1, 2013
81.279
+0.098
0.12%
jan 1, 2014
81.382
+0.103
0.13%
jan 1, 2015
81.498
+0.116
0.14%
Ranking of countries by current statistics by years


Comments: