29
/
en
AIzaSyAYiBZKx7MnpbEhh9jyipgxe19OcubqV5w
April 1, 2024
264825
Togo
TGO
true
2
1
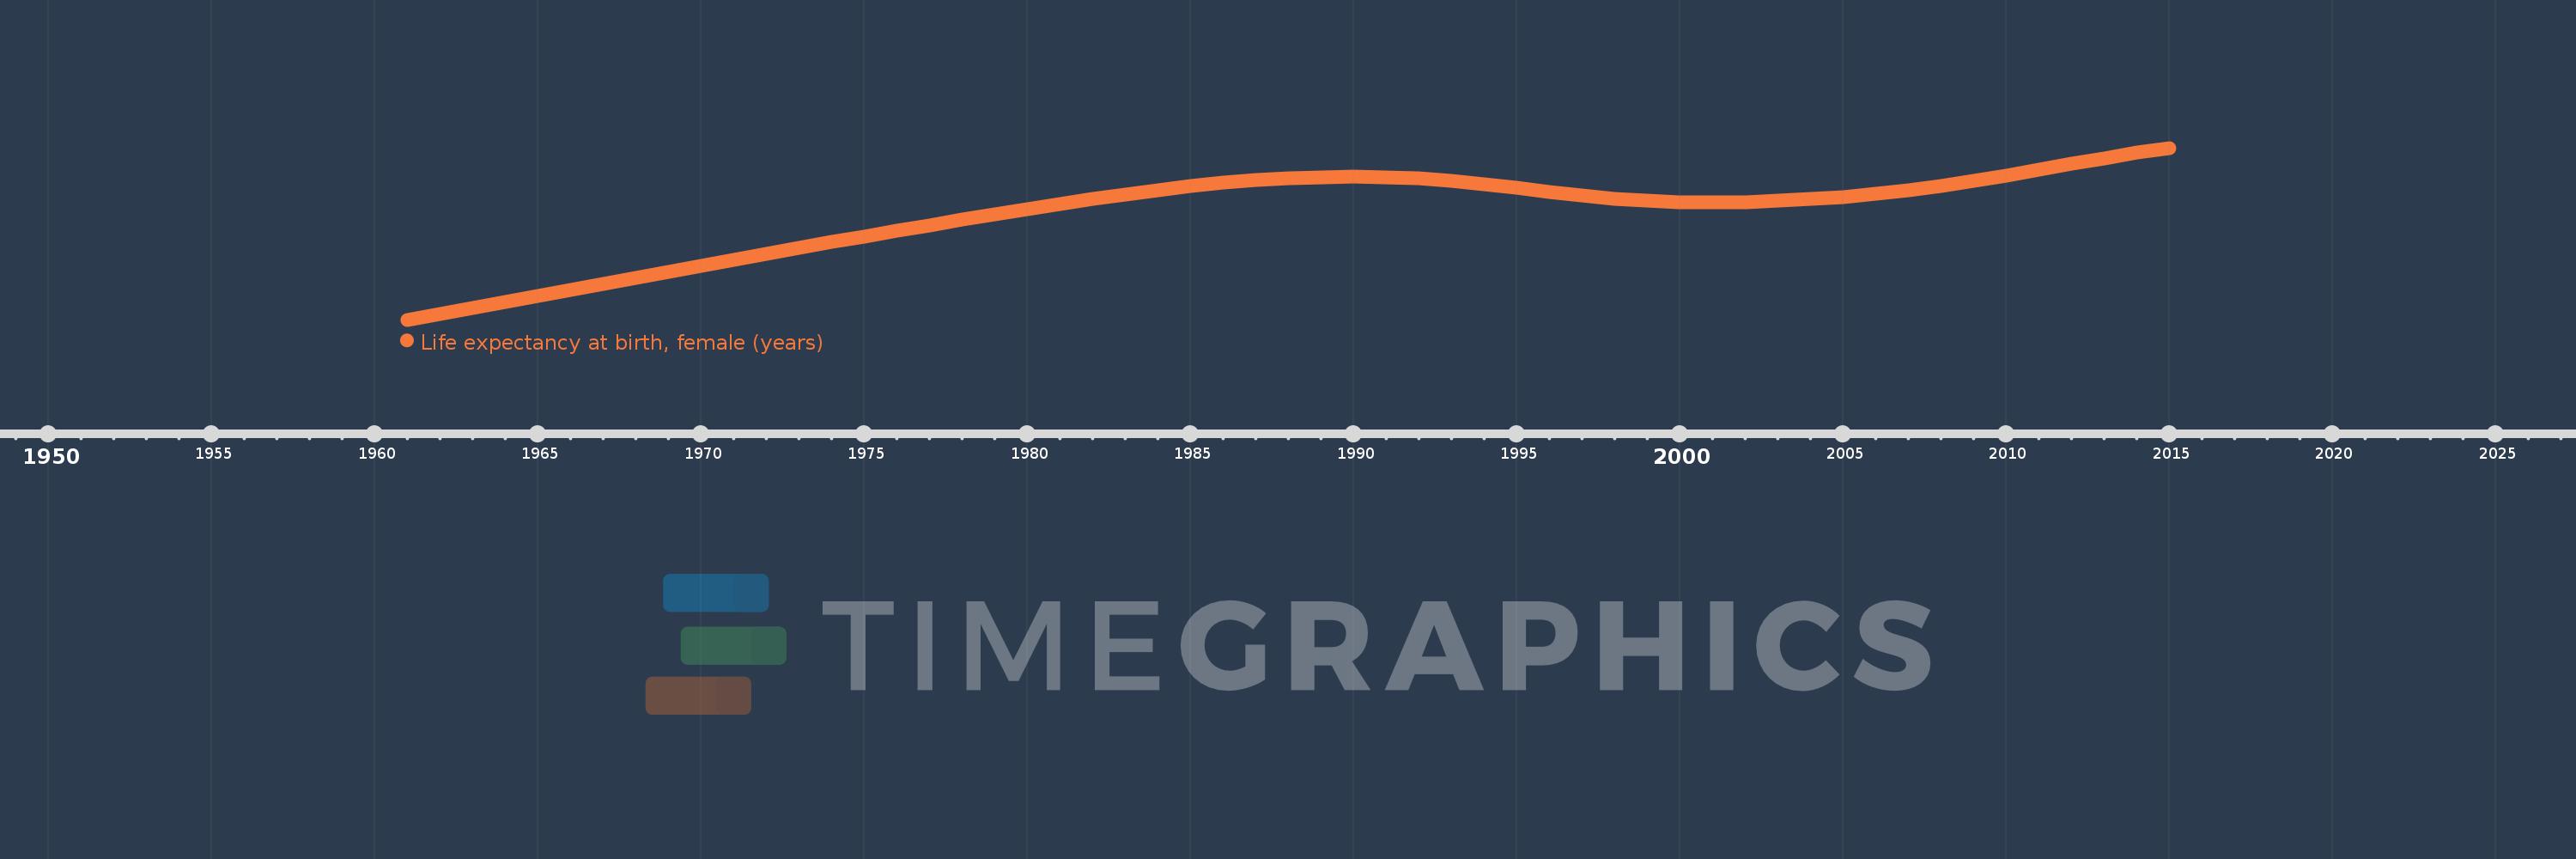
Life expectancy at birth, female (years)
2015,2014,2013,2012,2011,2010,2009,2008,2007,2006,2005,2004,2003,2002,2001,2000,1999,1998,1997,1996,1995,1994,1993,1992,1991,1990,1989,1988,1987,1986,1985,1984,1983,1982,1981,1980,1979,1978,1977,1976,1975,1974,1973,1972,1971,1970,1969,1968,1967,1966,1965,1964,1963,1962,1961
This statistics in other country:
AfghanistanAlbaniaAlgeriaAngolaAntigua and BarbudaArab WorldArgentinaArmeniaArubaAustraliaAustriaAzerbaijanBahamas, TheBahrainBangladeshBarbadosBelarusBelgiumBelizeBeninBermudaBhutanBoliviaBosnia and HerzegovinaBotswanaBrazilBrunei DarussalamBulgariaBurkina FasoBurundiCabo VerdeCambodiaCameroonCanadaCaribbean small statesCentral African RepublicCentral Europe and the BalticsChadChannel IslandsChileChinaColombiaComorosCongo, Dem. Rep.Congo, Rep.Costa RicaCote d'IvoireCroatiaCubaCuracaoCyprusCzech RepublicDenmarkDjiboutiDominicaDominican RepublicEarly-demographic dividendEast Asia & PacificEast Asia & Pacific (excluding high income)East Asia & Pacific (IDA & IBRD countries)EcuadorEgypt, Arab Rep.El SalvadorEquatorial GuineaEritreaEstoniaEthiopiaEuro areaEurope & Central AsiaEurope & Central Asia (excluding high income)Europe & Central Asia (IDA & IBRD countries)European UnionFaroe IslandsFijiFinlandFragile and conflict affected situationsFranceFrench PolynesiaGabonGambia, TheGeorgiaGermanyGhanaGreeceGreenlandGrenadaGuamGuatemalaGuineaGuinea-BissauGuyanaHaitiHeavily indebted poor countries (HIPC)High incomeHondurasHong Kong SAR, ChinaHungaryIBRD onlyIcelandIDA & IBRD totalIDA blendIDA onlyIDA totalIndiaIndonesiaIran, Islamic Rep.IraqIrelandIsle of ManIsraelItalyJamaicaJapanJordanKazakhstanKenyaKiribatiKorea, Dem. People’s Rep.Korea, Rep.KosovoKuwaitKyrgyz RepublicLao PDRLate-demographic dividendLatin America & Caribbean Latin America & Caribbean (excluding high income)Latin America & the Caribbean (IDA & IBRD countries)LatviaLeast developed countries: UN classificationLebanonLesothoLiberiaLibyaLiechtensteinLithuaniaLow & middle incomeLow incomeLower middle incomeLuxembourgMacao SAR, ChinaMacedonia, FYRMadagascarMalawiMalaysiaMaldivesMaliMaltaMarshall IslandsMauritaniaMauritiusMexicoMicronesia, Fed. Sts.Middle East & North AfricaMiddle East & North Africa (excluding high income)Middle East & North Africa (IDA & IBRD countries)Middle incomeMoldovaMongoliaMontenegroMoroccoMozambiqueMyanmarNamibiaNepalNetherlandsNew CaledoniaNew ZealandNicaraguaNigerNigeriaNorth AmericaNorwayOECD membersOmanOther small statesPacific island small statesPakistanPalauPanamaPapua New GuineaParaguayPeruPhilippinesPolandPortugalPost-demographic dividendPre-demographic dividendPuerto RicoQatarRomaniaRussian FederationRwandaSamoaSan MarinoSao Tome and PrincipeSaudi ArabiaSenegalSerbiaSeychellesSierra LeoneSingaporeSint Maarten (Dutch part)Slovak RepublicSloveniaSmall statesSolomon IslandsSomaliaSouth AfricaSouth AsiaSouth Asia (IDA & IBRD)South SudanSpainSri LankaSt. Kitts and NevisSt. LuciaSt. Martin (French part)St. Vincent and the GrenadinesSub-Saharan Africa Sub-Saharan Africa (excluding high income)Sub-Saharan Africa (IDA & IBRD countries)SudanSurinameSwazilandSwedenSwitzerlandSyrian Arab RepublicTajikistanTanzaniaThailandTimor-LesteTogoTongaTrinidad and TobagoTunisiaTurkeyTurkmenistanUgandaUkraineUnited Arab EmiratesUnited KingdomUnited StatesUpper middle incomeUruguayUzbekistanVanuatuVenezuela, RBVietnamVirgin Islands (U.S.)West Bank and GazaWorldYemen, Rep.ZambiaZimbabwe Timeline:
This timeline shows a graph from 1961 to 2015 of Togo. No data until 1960. Number of actual observations by date: 55.
Source name:
World Development Indicators
Source organization:
(1) United Nations Population Division. World Population Prospects, (2) Census reports and other statistical publications from national statistical offices, (3) Eurostat: Demographic Statistics, (4) United Nations Statistical Division. Population and Vital Statistics Reprot (various years), (5) U.S. Census Bureau: International Database, and (6) Secretariat of the Pacific Community: Statistics and Demography Programme.
Categories, topics:
Health, Gender, Social Development
Last updated:
apr 23, 2017
Indicators value changes by year
Minimum:
41.225
jan 1, 1961
Maximum:
60.399
jan 1, 2015
At the date of observation
Value
Absolute change
Change from previous value
jan 1, 1961
41.225
+41.225
0.0%
jan 1, 1962
41.904
+0.679
1.65%
jan 1, 1963
42.58
+0.676
1.61%
jan 1, 1964
43.253
+0.673
1.58%
jan 1, 1965
43.923
+0.67
1.55%
jan 1, 1966
44.591
+0.668
1.52%
jan 1, 1967
45.26
+0.669
1.5%
jan 1, 1968
45.93
+0.67
1.48%
jan 1, 1969
46.601
+0.671
1.46%
jan 1, 1970
47.271
+0.67
1.44%
jan 1, 1971
47.938
+0.667
1.41%
jan 1, 1972
48.6
+0.662
1.38%
jan 1, 1973
49.253
+0.653
1.34%
jan 1, 1974
49.895
+0.642
1.3%
jan 1, 1975
50.525
+0.63
1.26%
jan 1, 1976
51.144
+0.619
1.23%
jan 1, 1977
51.758
+0.614
1.2%
jan 1, 1978
52.367
+0.609
1.18%
jan 1, 1979
52.97
+0.603
1.15%
jan 1, 1980
53.561
+0.591
1.12%
jan 1, 1981
54.135
+0.574
1.07%
jan 1, 1982
54.689
+0.554
1.02%
jan 1, 1983
55.213
+0.524
0.96%
jan 1, 1984
55.696
+0.483
0.87%
jan 1, 1985
56.127
+0.431
0.77%
jan 1, 1986
56.494
+0.367
0.65%
jan 1, 1987
56.787
+0.293
0.52%
jan 1, 1988
57.002
+0.215
0.38%
jan 1, 1989
57.135
+0.133
0.23%
jan 1, 1990
57.183
+0.048
0.08%
jan 1, 1991
57.132
-0.051
-0.09%
jan 1, 1992
56.968
-0.164
-0.29%
jan 1, 1993
56.698
-0.27
-0.47%
jan 1, 1994
56.345
-0.353
-0.62%
jan 1, 1995
55.935
-0.41
-0.73%
jan 1, 1996
55.507
-0.428
-0.77%
jan 1, 1997
55.102
-0.405
-0.73%
jan 1, 1998
54.755
-0.347
-0.63%
jan 1, 1999
54.495
-0.26
-0.47%
jan 1, 2000
54.342
-0.153
-0.28%
jan 1, 2001
54.301
-0.041
-0.08%
jan 1, 2002
54.363
+0.062
0.11%
jan 1, 2003
54.503
+0.14
0.26%
jan 1, 2004
54.701
+0.198
0.36%
jan 1, 2005
54.952
+0.251
0.46%
jan 1, 2006
55.265
+0.313
0.57%
jan 1, 2007
55.655
+0.39
0.71%
jan 1, 2008
56.129
+0.474
0.85%
jan 1, 2009
56.682
+0.553
0.99%
jan 1, 2010
57.298
+0.616
1.09%
jan 1, 2011
57.951
+0.653
1.14%
jan 1, 2012
58.612
+0.661
1.14%
jan 1, 2013
59.253
+0.641
1.09%
jan 1, 2014
59.852
+0.599
1.01%
jan 1, 2015
60.399
+0.547
0.91%
Ranking of countries by current statistics by years


Comments: