29
/
en
AIzaSyAYiBZKx7MnpbEhh9jyipgxe19OcubqV5w
April 1, 2024
30020
Euro area
EMU
false
2
1
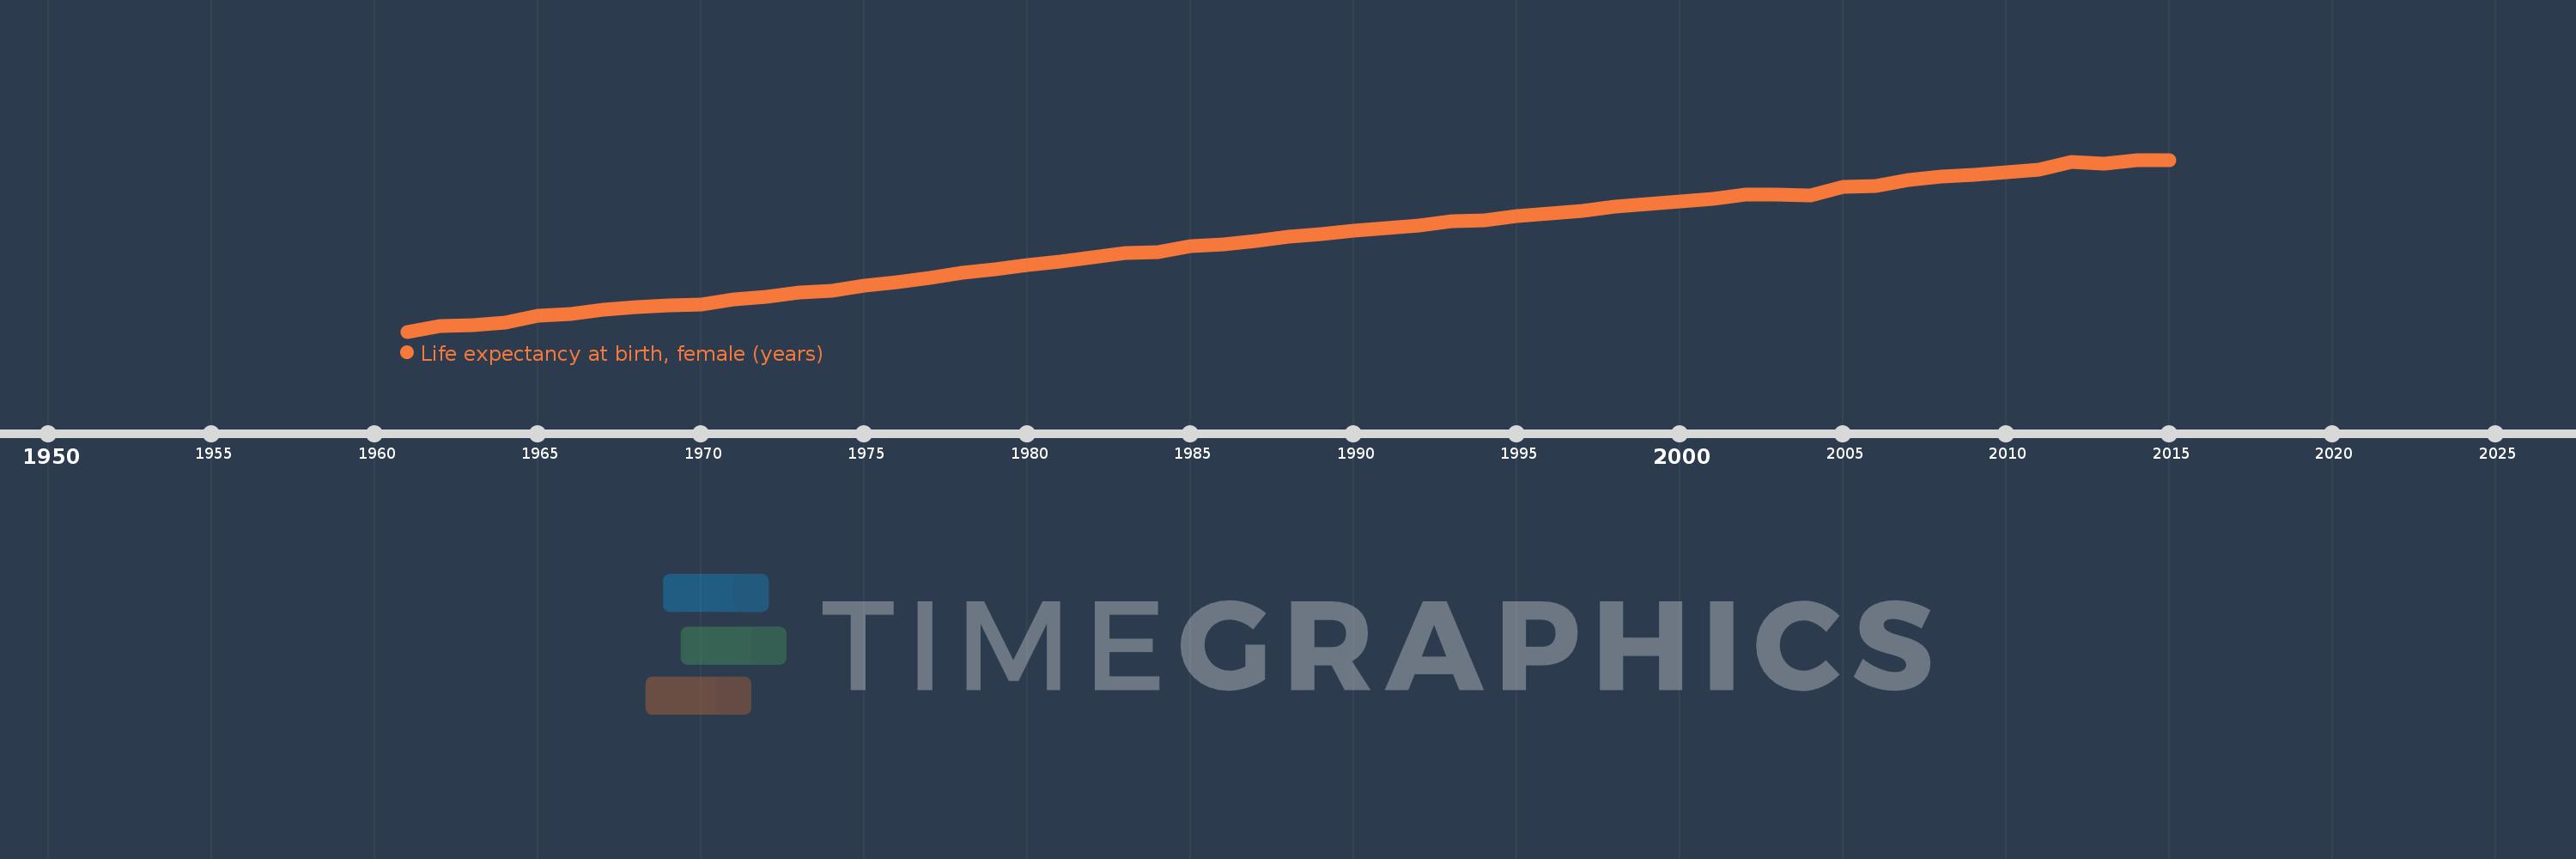
Life expectancy at birth, female (years)
2015,2014,2013,2012,2011,2010,2009,2008,2007,2006,2005,2004,2003,2002,2001,2000,1999,1998,1997,1996,1995,1994,1993,1992,1991,1990,1989,1988,1987,1986,1985,1984,1983,1982,1981,1980,1979,1978,1977,1976,1975,1974,1973,1972,1971,1970,1969,1968,1967,1966,1965,1964,1963,1962,1961
This statistics in other country:
AfghanistanAlbaniaAlgeriaAngolaAntigua and BarbudaArab WorldArgentinaArmeniaArubaAustraliaAustriaAzerbaijanBahamas, TheBahrainBangladeshBarbadosBelarusBelgiumBelizeBeninBermudaBhutanBoliviaBosnia and HerzegovinaBotswanaBrazilBrunei DarussalamBulgariaBurkina FasoBurundiCabo VerdeCambodiaCameroonCanadaCaribbean small statesCentral African RepublicCentral Europe and the BalticsChadChannel IslandsChileChinaColombiaComorosCongo, Dem. Rep.Congo, Rep.Costa RicaCote d'IvoireCroatiaCubaCuracaoCyprusCzech RepublicDenmarkDjiboutiDominicaDominican RepublicEarly-demographic dividendEast Asia & PacificEast Asia & Pacific (excluding high income)East Asia & Pacific (IDA & IBRD countries)EcuadorEgypt, Arab Rep.El SalvadorEquatorial GuineaEritreaEstoniaEthiopiaEuro areaEurope & Central AsiaEurope & Central Asia (excluding high income)Europe & Central Asia (IDA & IBRD countries)European UnionFaroe IslandsFijiFinlandFragile and conflict affected situationsFranceFrench PolynesiaGabonGambia, TheGeorgiaGermanyGhanaGreeceGreenlandGrenadaGuamGuatemalaGuineaGuinea-BissauGuyanaHaitiHeavily indebted poor countries (HIPC)High incomeHondurasHong Kong SAR, ChinaHungaryIBRD onlyIcelandIDA & IBRD totalIDA blendIDA onlyIDA totalIndiaIndonesiaIran, Islamic Rep.IraqIrelandIsle of ManIsraelItalyJamaicaJapanJordanKazakhstanKenyaKiribatiKorea, Dem. People’s Rep.Korea, Rep.KosovoKuwaitKyrgyz RepublicLao PDRLate-demographic dividendLatin America & Caribbean Latin America & Caribbean (excluding high income)Latin America & the Caribbean (IDA & IBRD countries)LatviaLeast developed countries: UN classificationLebanonLesothoLiberiaLibyaLiechtensteinLithuaniaLow & middle incomeLow incomeLower middle incomeLuxembourgMacao SAR, ChinaMacedonia, FYRMadagascarMalawiMalaysiaMaldivesMaliMaltaMarshall IslandsMauritaniaMauritiusMexicoMicronesia, Fed. Sts.Middle East & North AfricaMiddle East & North Africa (excluding high income)Middle East & North Africa (IDA & IBRD countries)Middle incomeMoldovaMongoliaMontenegroMoroccoMozambiqueMyanmarNamibiaNepalNetherlandsNew CaledoniaNew ZealandNicaraguaNigerNigeriaNorth AmericaNorwayOECD membersOmanOther small statesPacific island small statesPakistanPalauPanamaPapua New GuineaParaguayPeruPhilippinesPolandPortugalPost-demographic dividendPre-demographic dividendPuerto RicoQatarRomaniaRussian FederationRwandaSamoaSan MarinoSao Tome and PrincipeSaudi ArabiaSenegalSerbiaSeychellesSierra LeoneSingaporeSint Maarten (Dutch part)Slovak RepublicSloveniaSmall statesSolomon IslandsSomaliaSouth AfricaSouth AsiaSouth Asia (IDA & IBRD)South SudanSpainSri LankaSt. Kitts and NevisSt. LuciaSt. Martin (French part)St. Vincent and the GrenadinesSub-Saharan Africa Sub-Saharan Africa (excluding high income)Sub-Saharan Africa (IDA & IBRD countries)SudanSurinameSwazilandSwedenSwitzerlandSyrian Arab RepublicTajikistanTanzaniaThailandTimor-LesteTogoTongaTrinidad and TobagoTunisiaTurkeyTurkmenistanUgandaUkraineUnited Arab EmiratesUnited KingdomUnited StatesUpper middle incomeUruguayUzbekistanVanuatuVenezuela, RBVietnamVirgin Islands (U.S.)West Bank and GazaWorldYemen, Rep.ZambiaZimbabwe Timeline:
This timeline shows a graph from 1961 to 2015 of Euro area. No data until 1960. Number of actual observations by date: 55.
Source name:
World Development Indicators
Source organization:
(1) United Nations Population Division. World Population Prospects, (2) Census reports and other statistical publications from national statistical offices, (3) Eurostat: Demographic Statistics, (4) United Nations Statistical Division. Population and Vital Statistics Reprot (various years), (5) U.S. Census Bureau: International Database, and (6) Secretariat of the Pacific Community: Statistics and Demography Programme.
Categories, topics:
Health, Gender, Social Development
Last updated:
apr 23, 2017
Indicators value changes by year
Minimum:
72.063
jan 1, 1961
Maximum:
84.406
jan 1, 2015
At the date of observation
Value
Absolute change
Change from previous value
jan 1, 1961
72.063
+72.063
0.0%
jan 1, 1962
72.491
+0.428
0.59%
jan 1, 1963
72.497
+0.006
0.01%
jan 1, 1964
72.723
+0.226
0.31%
jan 1, 1965
73.234
+0.511
0.7%
jan 1, 1966
73.351
+0.117
0.16%
jan 1, 1967
73.653
+0.301
0.41%
jan 1, 1968
73.835
+0.182
0.25%
jan 1, 1969
73.931
+0.096
0.13%
jan 1, 1970
73.995
+0.064
0.09%
jan 1, 1971
74.367
+0.372
0.5%
jan 1, 1972
74.536
+0.169
0.23%
jan 1, 1973
74.89
+0.354
0.47%
jan 1, 1974
75.006
+0.116
0.16%
jan 1, 1975
75.386
+0.38
0.51%
jan 1, 1976
75.592
+0.207
0.27%
jan 1, 1977
75.892
+0.3
0.4%
jan 1, 1978
76.288
+0.396
0.52%
jan 1, 1979
76.527
+0.239
0.31%
jan 1, 1980
76.876
+0.349
0.46%
jan 1, 1981
77.08
+0.204
0.27%
jan 1, 1982
77.378
+0.298
0.39%
jan 1, 1983
77.712
+0.334
0.43%
jan 1, 1984
77.782
+0.07
0.09%
jan 1, 1985
78.174
+0.393
0.5%
jan 1, 1986
78.323
+0.149
0.19%
jan 1, 1987
78.593
+0.27
0.34%
jan 1, 1988
78.907
+0.314
0.4%
jan 1, 1989
79.097
+0.19
0.24%
jan 1, 1990
79.337
+0.24
0.3%
jan 1, 1991
79.481
+0.144
0.18%
jan 1, 1992
79.654
+0.173
0.22%
jan 1, 1993
80.019
+0.365
0.46%
jan 1, 1994
80.079
+0.06
0.08%
jan 1, 1995
80.389
+0.31
0.39%
jan 1, 1996
80.536
+0.147
0.18%
jan 1, 1997
80.743
+0.207
0.26%
jan 1, 1998
81.035
+0.292
0.36%
jan 1, 1999
81.207
+0.172
0.21%
jan 1, 2000
81.398
+0.191
0.23%
jan 1, 2001
81.619
+0.221
0.27%
jan 1, 2002
81.896
+0.277
0.34%
jan 1, 2003
81.925
+0.028
0.03%
jan 1, 2004
81.85
-0.074
-0.09%
jan 1, 2005
82.441
+0.591
0.72%
jan 1, 2006
82.554
+0.113
0.14%
jan 1, 2007
82.986
+0.432
0.52%
jan 1, 2008
83.183
+0.197
0.24%
jan 1, 2009
83.299
+0.116
0.14%
jan 1, 2010
83.483
+0.185
0.22%
jan 1, 2011
83.703
+0.22
0.26%
jan 1, 2012
84.221
+0.518
0.62%
jan 1, 2013
84.157
-0.063
-0.08%
jan 1, 2014
84.387
+0.23
0.27%
jan 1, 2015
84.406
+0.019
0.02%
Ranking of countries by current statistics by years


Comments: