29
/
en
AIzaSyAYiBZKx7MnpbEhh9jyipgxe19OcubqV5w
April 1, 2024
79648
Barbados
BRB
true
2
1
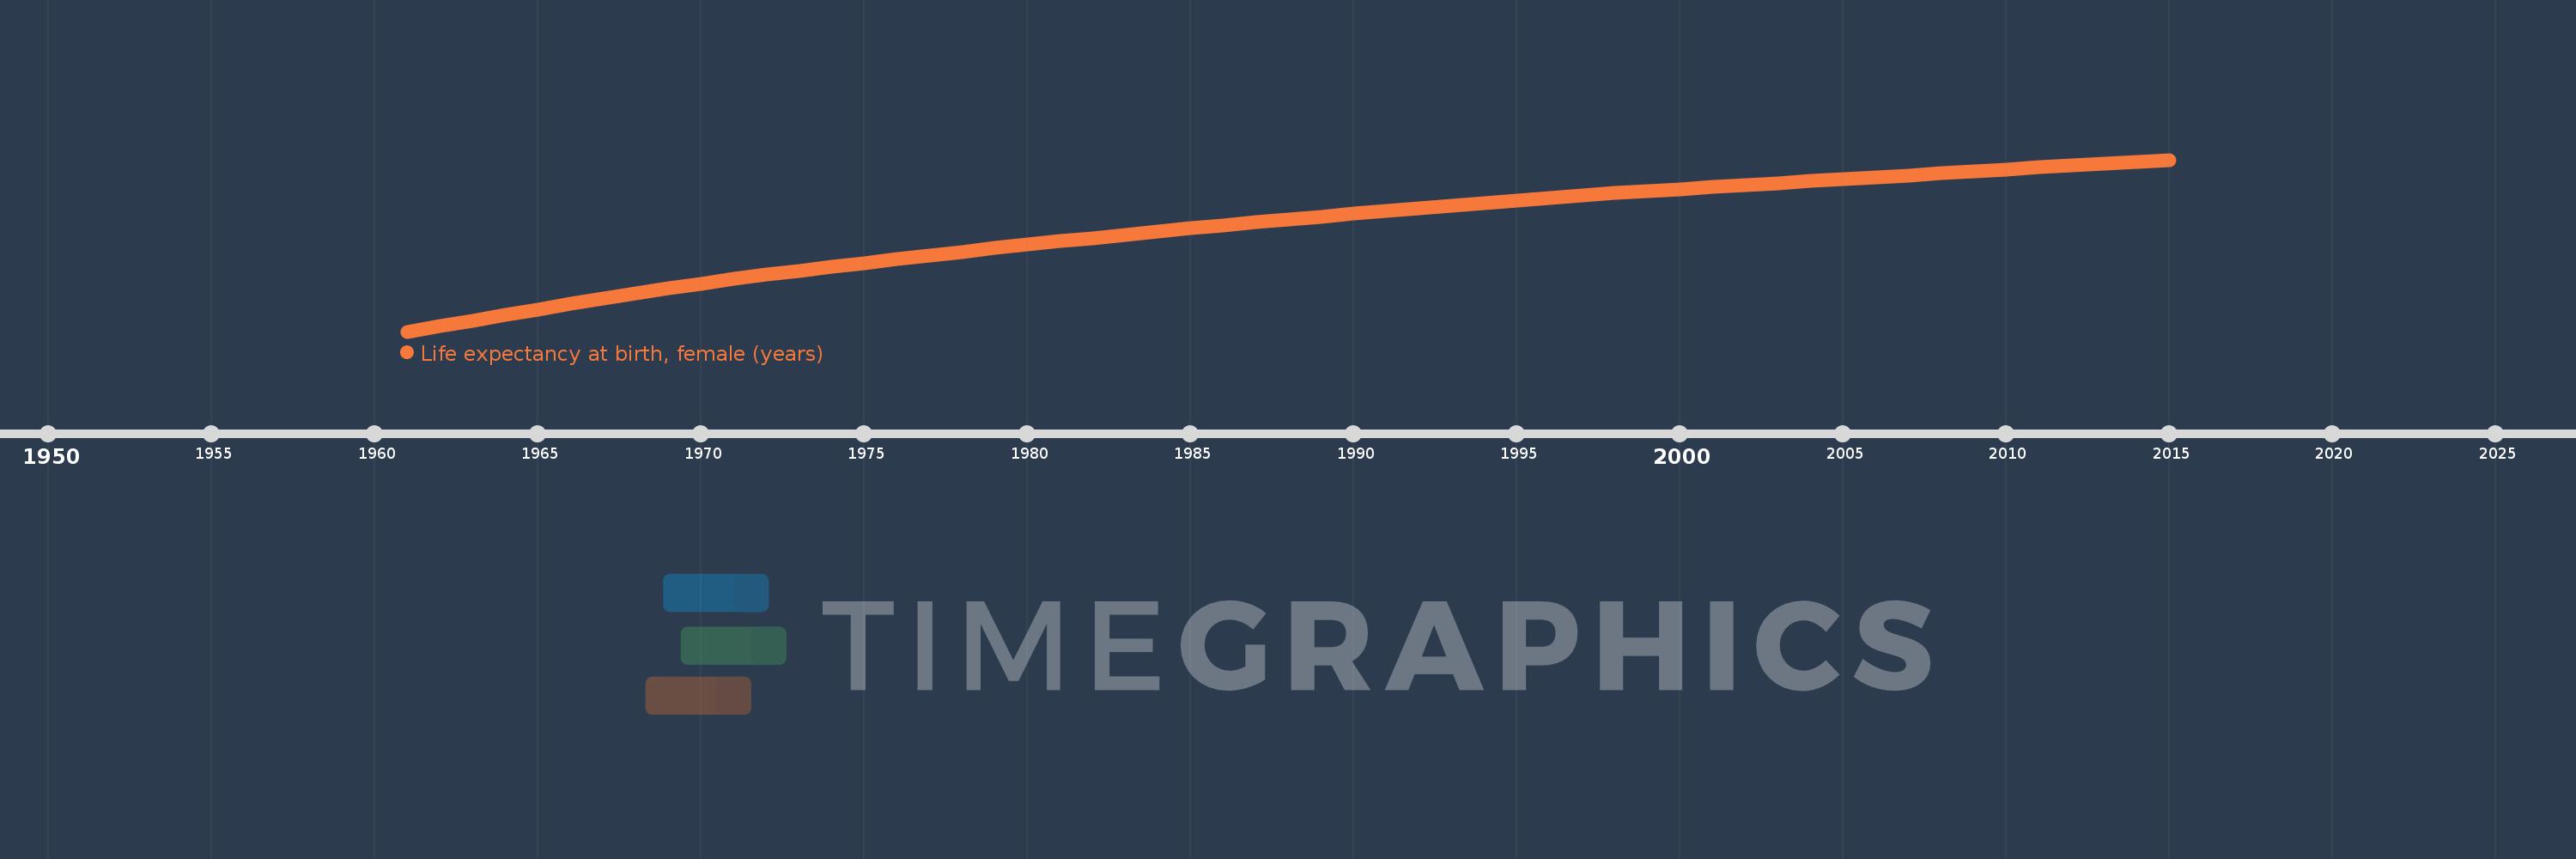
Life expectancy at birth, female (years)
2015,2014,2013,2012,2011,2010,2009,2008,2007,2006,2005,2004,2003,2002,2001,2000,1999,1998,1997,1996,1995,1994,1993,1992,1991,1990,1989,1988,1987,1986,1985,1984,1983,1982,1981,1980,1979,1978,1977,1976,1975,1974,1973,1972,1971,1970,1969,1968,1967,1966,1965,1964,1963,1962,1961
This statistics in other country:
AfghanistanAlbaniaAlgeriaAngolaAntigua and BarbudaArab WorldArgentinaArmeniaArubaAustraliaAustriaAzerbaijanBahamas, TheBahrainBangladeshBarbadosBelarusBelgiumBelizeBeninBermudaBhutanBoliviaBosnia and HerzegovinaBotswanaBrazilBrunei DarussalamBulgariaBurkina FasoBurundiCabo VerdeCambodiaCameroonCanadaCaribbean small statesCentral African RepublicCentral Europe and the BalticsChadChannel IslandsChileChinaColombiaComorosCongo, Dem. Rep.Congo, Rep.Costa RicaCote d'IvoireCroatiaCubaCuracaoCyprusCzech RepublicDenmarkDjiboutiDominicaDominican RepublicEarly-demographic dividendEast Asia & PacificEast Asia & Pacific (excluding high income)East Asia & Pacific (IDA & IBRD countries)EcuadorEgypt, Arab Rep.El SalvadorEquatorial GuineaEritreaEstoniaEthiopiaEuro areaEurope & Central AsiaEurope & Central Asia (excluding high income)Europe & Central Asia (IDA & IBRD countries)European UnionFaroe IslandsFijiFinlandFragile and conflict affected situationsFranceFrench PolynesiaGabonGambia, TheGeorgiaGermanyGhanaGreeceGreenlandGrenadaGuamGuatemalaGuineaGuinea-BissauGuyanaHaitiHeavily indebted poor countries (HIPC)High incomeHondurasHong Kong SAR, ChinaHungaryIBRD onlyIcelandIDA & IBRD totalIDA blendIDA onlyIDA totalIndiaIndonesiaIran, Islamic Rep.IraqIrelandIsle of ManIsraelItalyJamaicaJapanJordanKazakhstanKenyaKiribatiKorea, Dem. People’s Rep.Korea, Rep.KosovoKuwaitKyrgyz RepublicLao PDRLate-demographic dividendLatin America & Caribbean Latin America & Caribbean (excluding high income)Latin America & the Caribbean (IDA & IBRD countries)LatviaLeast developed countries: UN classificationLebanonLesothoLiberiaLibyaLiechtensteinLithuaniaLow & middle incomeLow incomeLower middle incomeLuxembourgMacao SAR, ChinaMacedonia, FYRMadagascarMalawiMalaysiaMaldivesMaliMaltaMarshall IslandsMauritaniaMauritiusMexicoMicronesia, Fed. Sts.Middle East & North AfricaMiddle East & North Africa (excluding high income)Middle East & North Africa (IDA & IBRD countries)Middle incomeMoldovaMongoliaMontenegroMoroccoMozambiqueMyanmarNamibiaNepalNetherlandsNew CaledoniaNew ZealandNicaraguaNigerNigeriaNorth AmericaNorwayOECD membersOmanOther small statesPacific island small statesPakistanPalauPanamaPapua New GuineaParaguayPeruPhilippinesPolandPortugalPost-demographic dividendPre-demographic dividendPuerto RicoQatarRomaniaRussian FederationRwandaSamoaSan MarinoSao Tome and PrincipeSaudi ArabiaSenegalSerbiaSeychellesSierra LeoneSingaporeSint Maarten (Dutch part)Slovak RepublicSloveniaSmall statesSolomon IslandsSomaliaSouth AfricaSouth AsiaSouth Asia (IDA & IBRD)South SudanSpainSri LankaSt. Kitts and NevisSt. LuciaSt. Martin (French part)St. Vincent and the GrenadinesSub-Saharan Africa Sub-Saharan Africa (excluding high income)Sub-Saharan Africa (IDA & IBRD countries)SudanSurinameSwazilandSwedenSwitzerlandSyrian Arab RepublicTajikistanTanzaniaThailandTimor-LesteTogoTongaTrinidad and TobagoTunisiaTurkeyTurkmenistanUgandaUkraineUnited Arab EmiratesUnited KingdomUnited StatesUpper middle incomeUruguayUzbekistanVanuatuVenezuela, RBVietnamVirgin Islands (U.S.)West Bank and GazaWorldYemen, Rep.ZambiaZimbabwe Timeline:
This timeline shows a graph from 1961 to 2015 of Barbados. No data until 1960. Number of actual observations by date: 55.
Source name:
World Development Indicators
Source organization:
(1) United Nations Population Division. World Population Prospects, (2) Census reports and other statistical publications from national statistical offices, (3) Eurostat: Demographic Statistics, (4) United Nations Statistical Division. Population and Vital Statistics Reprot (various years), (5) U.S. Census Bureau: International Database, and (6) Secretariat of the Pacific Community: Statistics and Demography Programme.
Categories, topics:
Health, Gender, Social Development
Last updated:
apr 23, 2017
Indicators value changes by year
Minimum:
63.025
jan 1, 1961
Maximum:
77.957
jan 1, 2015
At the date of observation
Value
Absolute change
Change from previous value
jan 1, 1961
63.025
+63.025
0.0%
jan 1, 1962
63.5
+0.475
0.75%
jan 1, 1963
63.978
+0.478
0.75%
jan 1, 1964
64.46
+0.482
0.75%
jan 1, 1965
64.946
+0.486
0.75%
jan 1, 1966
65.428
+0.482
0.74%
jan 1, 1967
65.901
+0.473
0.72%
jan 1, 1968
66.357
+0.456
0.69%
jan 1, 1969
66.792
+0.435
0.66%
jan 1, 1970
67.202
+0.41
0.61%
jan 1, 1971
67.589
+0.387
0.58%
jan 1, 1972
67.956
+0.367
0.54%
jan 1, 1973
68.309
+0.353
0.52%
jan 1, 1974
68.651
+0.342
0.5%
jan 1, 1975
68.987
+0.336
0.49%
jan 1, 1976
69.317
+0.33
0.48%
jan 1, 1977
69.642
+0.325
0.47%
jan 1, 1978
69.96
+0.318
0.46%
jan 1, 1979
70.271
+0.311
0.44%
jan 1, 1980
70.575
+0.304
0.43%
jan 1, 1981
70.872
+0.297
0.42%
jan 1, 1982
71.162
+0.29
0.41%
jan 1, 1983
71.446
+0.284
0.4%
jan 1, 1984
71.722
+0.276
0.39%
jan 1, 1985
71.993
+0.271
0.38%
jan 1, 1986
72.257
+0.264
0.37%
jan 1, 1987
72.517
+0.26
0.36%
jan 1, 1988
72.771
+0.254
0.35%
jan 1, 1989
73.02
+0.249
0.34%
jan 1, 1990
73.264
+0.244
0.33%
jan 1, 1991
73.505
+0.241
0.33%
jan 1, 1992
73.741
+0.236
0.32%
jan 1, 1993
73.974
+0.233
0.32%
jan 1, 1994
74.202
+0.228
0.31%
jan 1, 1995
74.425
+0.223
0.3%
jan 1, 1996
74.641
+0.216
0.29%
jan 1, 1997
74.849
+0.208
0.28%
jan 1, 1998
75.048
+0.199
0.27%
jan 1, 1999
75.237
+0.189
0.25%
jan 1, 2000
75.418
+0.181
0.24%
jan 1, 2001
75.592
+0.174
0.23%
jan 1, 2002
75.76
+0.168
0.22%
jan 1, 2003
75.927
+0.167
0.22%
jan 1, 2004
76.094
+0.167
0.22%
jan 1, 2005
76.261
+0.167
0.22%
jan 1, 2006
76.431
+0.17
0.22%
jan 1, 2007
76.603
+0.172
0.23%
jan 1, 2008
76.775
+0.172
0.22%
jan 1, 2009
76.947
+0.172
0.22%
jan 1, 2010
77.119
+0.172
0.22%
jan 1, 2011
77.29
+0.171
0.22%
jan 1, 2012
77.459
+0.169
0.22%
jan 1, 2013
77.627
+0.168
0.22%
jan 1, 2014
77.793
+0.166
0.21%
jan 1, 2015
77.957
+0.164
0.21%
Ranking of countries by current statistics by years


Comments: