29
/
en
AIzaSyAYiBZKx7MnpbEhh9jyipgxe19OcubqV5w
April 1, 2024
252087
St. Vincent and the Grenadines
VCT
true
2
1
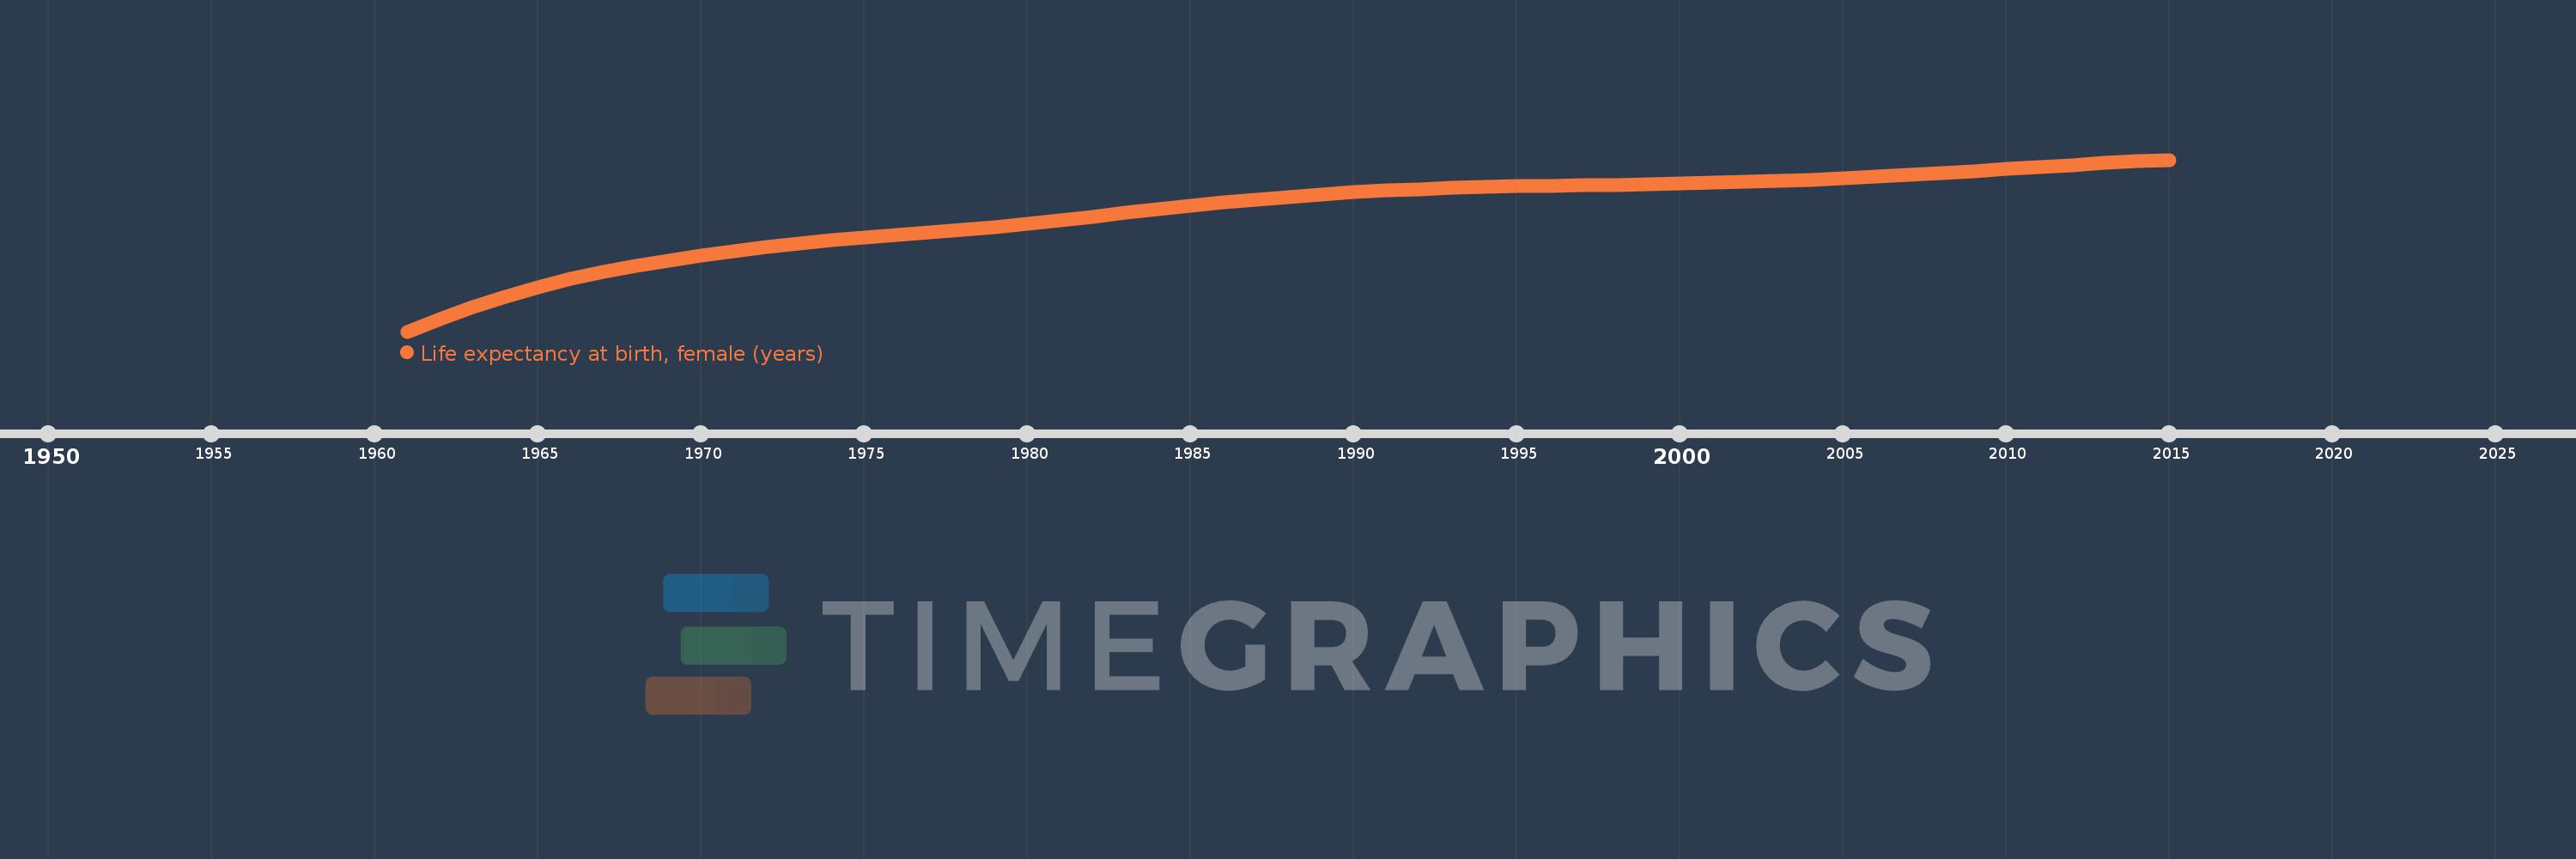
Life expectancy at birth, female (years)
2015,2014,2013,2012,2011,2010,2009,2008,2007,2006,2005,2004,2003,2002,2001,2000,1999,1998,1997,1996,1995,1994,1993,1992,1991,1990,1989,1988,1987,1986,1985,1984,1983,1982,1981,1980,1979,1978,1977,1976,1975,1974,1973,1972,1971,1970,1969,1968,1967,1966,1965,1964,1963,1962,1961
This statistics in other country:
AfghanistanAlbaniaAlgeriaAngolaAntigua and BarbudaArab WorldArgentinaArmeniaArubaAustraliaAustriaAzerbaijanBahamas, TheBahrainBangladeshBarbadosBelarusBelgiumBelizeBeninBermudaBhutanBoliviaBosnia and HerzegovinaBotswanaBrazilBrunei DarussalamBulgariaBurkina FasoBurundiCabo VerdeCambodiaCameroonCanadaCaribbean small statesCentral African RepublicCentral Europe and the BalticsChadChannel IslandsChileChinaColombiaComorosCongo, Dem. Rep.Congo, Rep.Costa RicaCote d'IvoireCroatiaCubaCuracaoCyprusCzech RepublicDenmarkDjiboutiDominicaDominican RepublicEarly-demographic dividendEast Asia & PacificEast Asia & Pacific (excluding high income)East Asia & Pacific (IDA & IBRD countries)EcuadorEgypt, Arab Rep.El SalvadorEquatorial GuineaEritreaEstoniaEthiopiaEuro areaEurope & Central AsiaEurope & Central Asia (excluding high income)Europe & Central Asia (IDA & IBRD countries)European UnionFaroe IslandsFijiFinlandFragile and conflict affected situationsFranceFrench PolynesiaGabonGambia, TheGeorgiaGermanyGhanaGreeceGreenlandGrenadaGuamGuatemalaGuineaGuinea-BissauGuyanaHaitiHeavily indebted poor countries (HIPC)High incomeHondurasHong Kong SAR, ChinaHungaryIBRD onlyIcelandIDA & IBRD totalIDA blendIDA onlyIDA totalIndiaIndonesiaIran, Islamic Rep.IraqIrelandIsle of ManIsraelItalyJamaicaJapanJordanKazakhstanKenyaKiribatiKorea, Dem. People’s Rep.Korea, Rep.KosovoKuwaitKyrgyz RepublicLao PDRLate-demographic dividendLatin America & Caribbean Latin America & Caribbean (excluding high income)Latin America & the Caribbean (IDA & IBRD countries)LatviaLeast developed countries: UN classificationLebanonLesothoLiberiaLibyaLiechtensteinLithuaniaLow & middle incomeLow incomeLower middle incomeLuxembourgMacao SAR, ChinaMacedonia, FYRMadagascarMalawiMalaysiaMaldivesMaliMaltaMarshall IslandsMauritaniaMauritiusMexicoMicronesia, Fed. Sts.Middle East & North AfricaMiddle East & North Africa (excluding high income)Middle East & North Africa (IDA & IBRD countries)Middle incomeMoldovaMongoliaMontenegroMoroccoMozambiqueMyanmarNamibiaNepalNetherlandsNew CaledoniaNew ZealandNicaraguaNigerNigeriaNorth AmericaNorwayOECD membersOmanOther small statesPacific island small statesPakistanPalauPanamaPapua New GuineaParaguayPeruPhilippinesPolandPortugalPost-demographic dividendPre-demographic dividendPuerto RicoQatarRomaniaRussian FederationRwandaSamoaSan MarinoSao Tome and PrincipeSaudi ArabiaSenegalSerbiaSeychellesSierra LeoneSingaporeSint Maarten (Dutch part)Slovak RepublicSloveniaSmall statesSolomon IslandsSomaliaSouth AfricaSouth AsiaSouth Asia (IDA & IBRD)South SudanSpainSri LankaSt. Kitts and NevisSt. LuciaSt. Martin (French part)St. Vincent and the GrenadinesSub-Saharan Africa Sub-Saharan Africa (excluding high income)Sub-Saharan Africa (IDA & IBRD countries)SudanSurinameSwazilandSwedenSwitzerlandSyrian Arab RepublicTajikistanTanzaniaThailandTimor-LesteTogoTongaTrinidad and TobagoTunisiaTurkeyTurkmenistanUgandaUkraineUnited Arab EmiratesUnited KingdomUnited StatesUpper middle incomeUruguayUzbekistanVanuatuVenezuela, RBVietnamVirgin Islands (U.S.)West Bank and GazaWorldYemen, Rep.ZambiaZimbabwe Timeline:
This timeline shows a graph from 1961 to 2015 of St. Vincent and the Grenadines. No data until 1960. Number of actual observations by date: 55.
Source name:
World Development Indicators
Source organization:
(1) United Nations Population Division. World Population Prospects, (2) Census reports and other statistical publications from national statistical offices, (3) Eurostat: Demographic Statistics, (4) United Nations Statistical Division. Population and Vital Statistics Reprot (various years), (5) U.S. Census Bureau: International Database, and (6) Secretariat of the Pacific Community: Statistics and Demography Programme.
Categories, topics:
Health, Gender, Social Development
Last updated:
apr 23, 2017
Indicators value changes by year
Minimum:
59.724
jan 1, 1961
Maximum:
75.106
jan 1, 2015
At the date of observation
Value
Absolute change
Change from previous value
jan 1, 1961
59.724
+59.724
0.0%
jan 1, 1962
60.839
+1.115
1.87%
jan 1, 1963
61.888
+1.049
1.72%
jan 1, 1964
62.845
+0.957
1.55%
jan 1, 1965
63.694
+0.849
1.35%
jan 1, 1966
64.428
+0.734
1.15%
jan 1, 1967
65.056
+0.628
0.97%
jan 1, 1968
65.604
+0.548
0.84%
jan 1, 1969
66.095
+0.491
0.75%
jan 1, 1970
66.539
+0.444
0.67%
jan 1, 1971
66.941
+0.402
0.6%
jan 1, 1972
67.298
+0.357
0.53%
jan 1, 1973
67.612
+0.314
0.47%
jan 1, 1974
67.886
+0.274
0.41%
jan 1, 1975
68.131
+0.245
0.36%
jan 1, 1976
68.363
+0.232
0.34%
jan 1, 1977
68.596
+0.233
0.34%
jan 1, 1978
68.84
+0.244
0.36%
jan 1, 1979
69.102
+0.262
0.38%
jan 1, 1980
69.385
+0.283
0.41%
jan 1, 1981
69.69
+0.305
0.44%
jan 1, 1982
70.014
+0.324
0.46%
jan 1, 1983
70.344
+0.33
0.47%
jan 1, 1984
70.67
+0.326
0.46%
jan 1, 1985
70.984
+0.314
0.44%
jan 1, 1986
71.278
+0.294
0.41%
jan 1, 1987
71.548
+0.27
0.38%
jan 1, 1988
71.793
+0.245
0.34%
jan 1, 1989
72.01
+0.217
0.3%
jan 1, 1990
72.199
+0.189
0.26%
jan 1, 1991
72.359
+0.16
0.22%
jan 1, 1992
72.487
+0.128
0.18%
jan 1, 1993
72.588
+0.101
0.14%
jan 1, 1994
72.667
+0.079
0.11%
jan 1, 1995
72.73
+0.063
0.09%
jan 1, 1996
72.782
+0.052
0.07%
jan 1, 1997
72.827
+0.045
0.06%
jan 1, 1998
72.87
+0.043
0.06%
jan 1, 1999
72.915
+0.045
0.06%
jan 1, 2000
72.968
+0.053
0.07%
jan 1, 2001
73.034
+0.066
0.09%
jan 1, 2002
73.115
+0.081
0.11%
jan 1, 2003
73.211
+0.096
0.13%
jan 1, 2004
73.321
+0.11
0.15%
jan 1, 2005
73.445
+0.124
0.17%
jan 1, 2006
73.585
+0.14
0.19%
jan 1, 2007
73.74
+0.155
0.21%
jan 1, 2008
73.908
+0.168
0.23%
jan 1, 2009
74.085
+0.177
0.24%
jan 1, 2010
74.268
+0.183
0.25%
jan 1, 2011
74.451
+0.183
0.25%
jan 1, 2012
74.629
+0.178
0.24%
jan 1, 2013
74.799
+0.17
0.23%
jan 1, 2014
74.958
+0.159
0.21%
jan 1, 2015
75.106
+0.148
0.2%
Ranking of countries by current statistics by years


Comments: