29
/
en
AIzaSyAYiBZKx7MnpbEhh9jyipgxe19OcubqV5w
April 1, 2024
108723
Comoros
COM
true
2
1
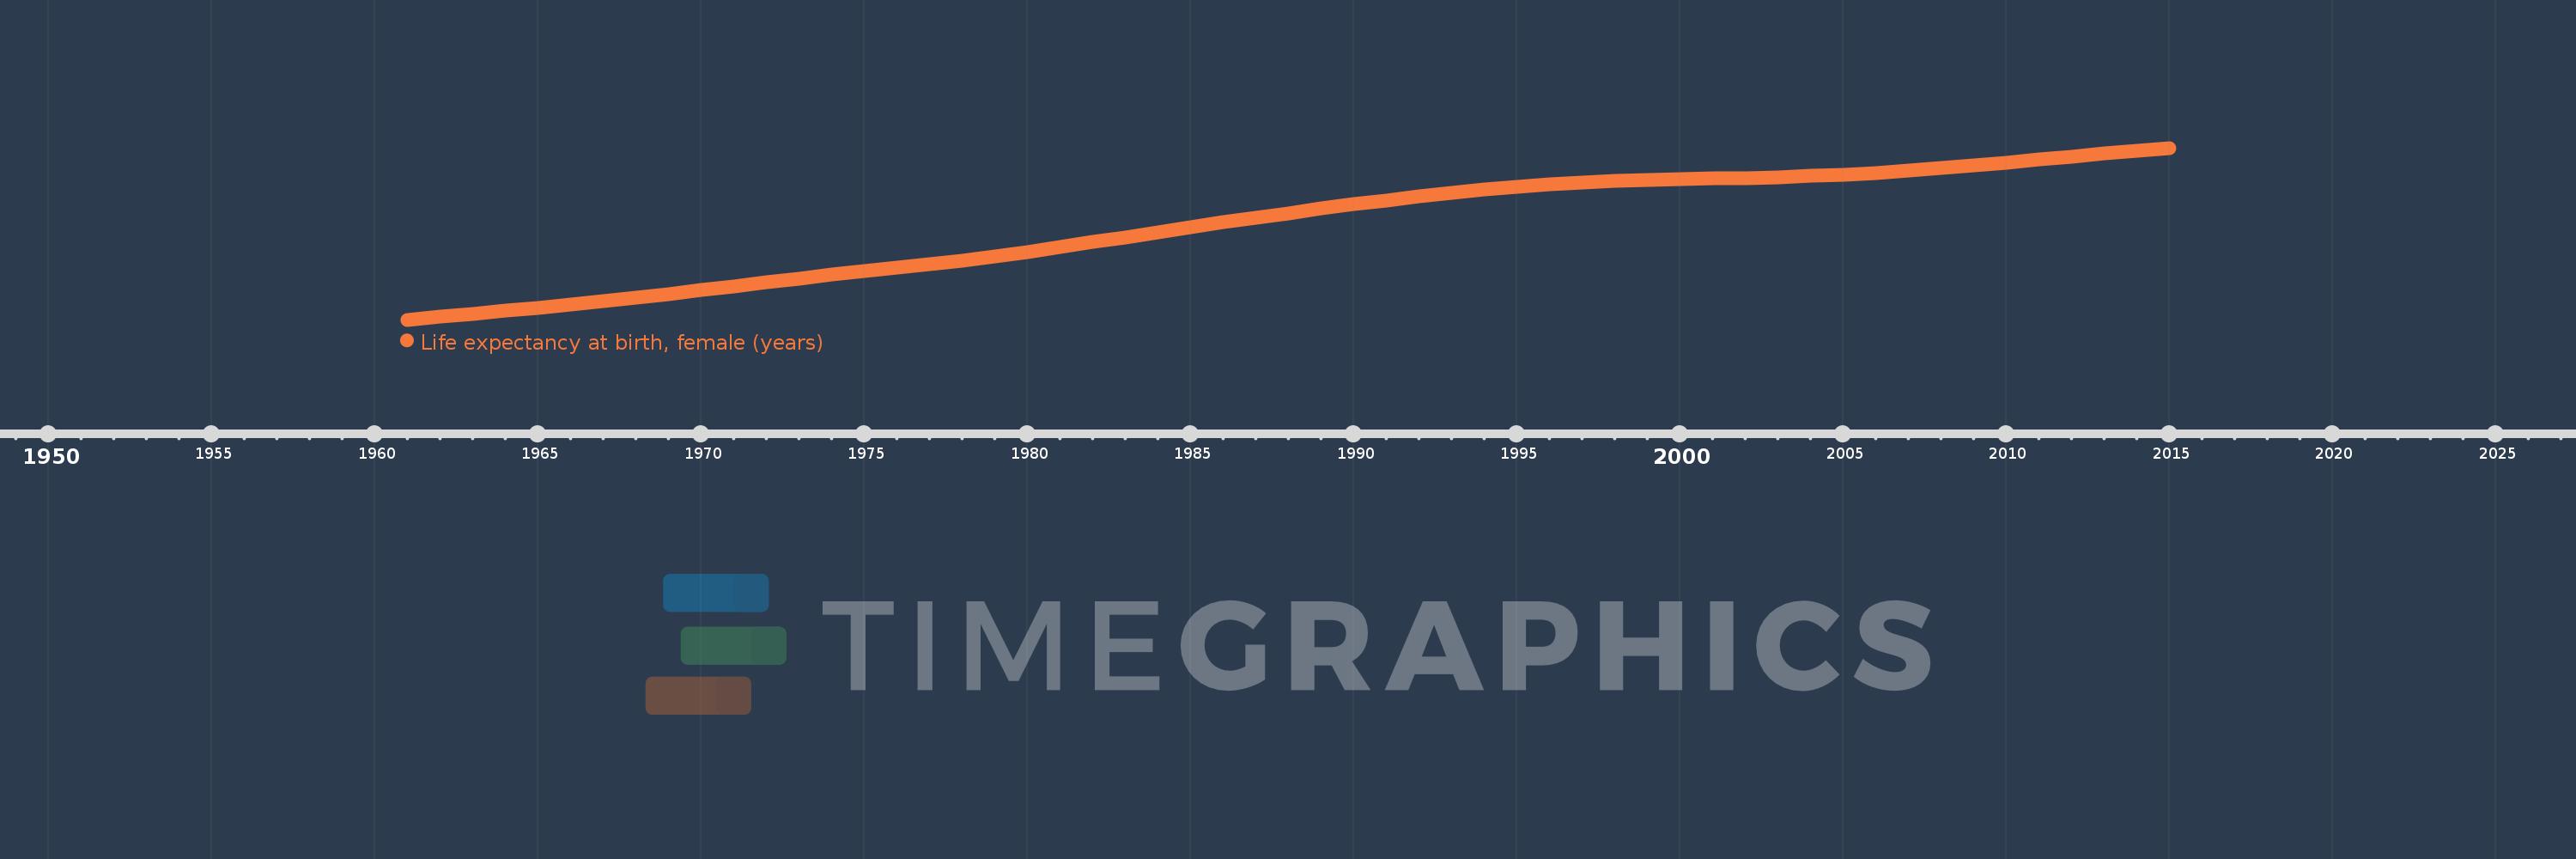
Life expectancy at birth, female (years)
2015,2014,2013,2012,2011,2010,2009,2008,2007,2006,2005,2004,2003,2002,2001,2000,1999,1998,1997,1996,1995,1994,1993,1992,1991,1990,1989,1988,1987,1986,1985,1984,1983,1982,1981,1980,1979,1978,1977,1976,1975,1974,1973,1972,1971,1970,1969,1968,1967,1966,1965,1964,1963,1962,1961
This statistics in other country:
AfghanistanAlbaniaAlgeriaAngolaAntigua and BarbudaArab WorldArgentinaArmeniaArubaAustraliaAustriaAzerbaijanBahamas, TheBahrainBangladeshBarbadosBelarusBelgiumBelizeBeninBermudaBhutanBoliviaBosnia and HerzegovinaBotswanaBrazilBrunei DarussalamBulgariaBurkina FasoBurundiCabo VerdeCambodiaCameroonCanadaCaribbean small statesCentral African RepublicCentral Europe and the BalticsChadChannel IslandsChileChinaColombiaComorosCongo, Dem. Rep.Congo, Rep.Costa RicaCote d'IvoireCroatiaCubaCuracaoCyprusCzech RepublicDenmarkDjiboutiDominicaDominican RepublicEarly-demographic dividendEast Asia & PacificEast Asia & Pacific (excluding high income)East Asia & Pacific (IDA & IBRD countries)EcuadorEgypt, Arab Rep.El SalvadorEquatorial GuineaEritreaEstoniaEthiopiaEuro areaEurope & Central AsiaEurope & Central Asia (excluding high income)Europe & Central Asia (IDA & IBRD countries)European UnionFaroe IslandsFijiFinlandFragile and conflict affected situationsFranceFrench PolynesiaGabonGambia, TheGeorgiaGermanyGhanaGreeceGreenlandGrenadaGuamGuatemalaGuineaGuinea-BissauGuyanaHaitiHeavily indebted poor countries (HIPC)High incomeHondurasHong Kong SAR, ChinaHungaryIBRD onlyIcelandIDA & IBRD totalIDA blendIDA onlyIDA totalIndiaIndonesiaIran, Islamic Rep.IraqIrelandIsle of ManIsraelItalyJamaicaJapanJordanKazakhstanKenyaKiribatiKorea, Dem. People’s Rep.Korea, Rep.KosovoKuwaitKyrgyz RepublicLao PDRLate-demographic dividendLatin America & Caribbean Latin America & Caribbean (excluding high income)Latin America & the Caribbean (IDA & IBRD countries)LatviaLeast developed countries: UN classificationLebanonLesothoLiberiaLibyaLiechtensteinLithuaniaLow & middle incomeLow incomeLower middle incomeLuxembourgMacao SAR, ChinaMacedonia, FYRMadagascarMalawiMalaysiaMaldivesMaliMaltaMarshall IslandsMauritaniaMauritiusMexicoMicronesia, Fed. Sts.Middle East & North AfricaMiddle East & North Africa (excluding high income)Middle East & North Africa (IDA & IBRD countries)Middle incomeMoldovaMongoliaMontenegroMoroccoMozambiqueMyanmarNamibiaNepalNetherlandsNew CaledoniaNew ZealandNicaraguaNigerNigeriaNorth AmericaNorwayOECD membersOmanOther small statesPacific island small statesPakistanPalauPanamaPapua New GuineaParaguayPeruPhilippinesPolandPortugalPost-demographic dividendPre-demographic dividendPuerto RicoQatarRomaniaRussian FederationRwandaSamoaSan MarinoSao Tome and PrincipeSaudi ArabiaSenegalSerbiaSeychellesSierra LeoneSingaporeSint Maarten (Dutch part)Slovak RepublicSloveniaSmall statesSolomon IslandsSomaliaSouth AfricaSouth AsiaSouth Asia (IDA & IBRD)South SudanSpainSri LankaSt. Kitts and NevisSt. LuciaSt. Martin (French part)St. Vincent and the GrenadinesSub-Saharan Africa Sub-Saharan Africa (excluding high income)Sub-Saharan Africa (IDA & IBRD countries)SudanSurinameSwazilandSwedenSwitzerlandSyrian Arab RepublicTajikistanTanzaniaThailandTimor-LesteTogoTongaTrinidad and TobagoTunisiaTurkeyTurkmenistanUgandaUkraineUnited Arab EmiratesUnited KingdomUnited StatesUpper middle incomeUruguayUzbekistanVanuatuVenezuela, RBVietnamVirgin Islands (U.S.)West Bank and GazaWorldYemen, Rep.ZambiaZimbabwe Timeline:
This timeline shows a graph from 1961 to 2015 of Comoros. No data until 1960. Number of actual observations by date: 55.
Source name:
World Development Indicators
Source organization:
(1) United Nations Population Division. World Population Prospects, (2) Census reports and other statistical publications from national statistical offices, (3) Eurostat: Demographic Statistics, (4) United Nations Statistical Division. Population and Vital Statistics Reprot (various years), (5) U.S. Census Bureau: International Database, and (6) Secretariat of the Pacific Community: Statistics and Demography Programme.
Categories, topics:
Health, Gender, Social Development
Last updated:
apr 23, 2017
Indicators value changes by year
Minimum:
42.999
jan 1, 1961
Maximum:
64.964
jan 1, 2015
At the date of observation
Value
Absolute change
Change from previous value
jan 1, 1961
42.999
+42.999
0.0%
jan 1, 1962
43.392
+0.393
0.91%
jan 1, 1963
43.781
+0.389
0.9%
jan 1, 1964
44.168
+0.387
0.88%
jan 1, 1965
44.557
+0.389
0.88%
jan 1, 1966
44.956
+0.399
0.9%
jan 1, 1967
45.374
+0.418
0.93%
jan 1, 1968
45.817
+0.443
0.98%
jan 1, 1969
46.285
+0.468
1.02%
jan 1, 1970
46.776
+0.491
1.06%
jan 1, 1971
47.279
+0.503
1.08%
jan 1, 1972
47.779
+0.5
1.06%
jan 1, 1973
48.266
+0.487
1.02%
jan 1, 1974
48.733
+0.467
0.97%
jan 1, 1975
49.185
+0.452
0.93%
jan 1, 1976
49.631
+0.446
0.91%
jan 1, 1977
50.089
+0.458
0.92%
jan 1, 1978
50.576
+0.487
0.97%
jan 1, 1979
51.103
+0.527
1.04%
jan 1, 1980
51.67
+0.567
1.11%
jan 1, 1981
52.276
+0.606
1.17%
jan 1, 1982
52.91
+0.634
1.21%
jan 1, 1983
53.557
+0.647
1.22%
jan 1, 1984
54.201
+0.644
1.2%
jan 1, 1985
54.833
+0.632
1.17%
jan 1, 1986
55.449
+0.616
1.12%
jan 1, 1987
56.048
+0.599
1.08%
jan 1, 1988
56.632
+0.584
1.04%
jan 1, 1989
57.201
+0.569
1.0%
jan 1, 1990
57.747
+0.546
0.95%
jan 1, 1991
58.266
+0.519
0.9%
jan 1, 1992
58.753
+0.487
0.84%
jan 1, 1993
59.202
+0.449
0.76%
jan 1, 1994
59.611
+0.409
0.69%
jan 1, 1995
59.975
+0.364
0.61%
jan 1, 1996
60.286
+0.311
0.52%
jan 1, 1997
60.536
+0.25
0.41%
jan 1, 1998
60.728
+0.192
0.32%
jan 1, 1999
60.87
+0.142
0.23%
jan 1, 2000
60.975
+0.105
0.17%
jan 1, 2001
61.06
+0.085
0.14%
jan 1, 2002
61.142
+0.082
0.13%
jan 1, 2003
61.24
+0.098
0.16%
jan 1, 2004
61.367
+0.127
0.21%
jan 1, 2005
61.537
+0.17
0.28%
jan 1, 2006
61.757
+0.22
0.36%
jan 1, 2007
62.034
+0.277
0.45%
jan 1, 2008
62.357
+0.323
0.52%
jan 1, 2009
62.714
+0.357
0.57%
jan 1, 2010
63.095
+0.381
0.61%
jan 1, 2011
63.489
+0.394
0.62%
jan 1, 2012
63.882
+0.393
0.62%
jan 1, 2013
64.264
+0.382
0.6%
jan 1, 2014
64.626
+0.362
0.56%
jan 1, 2015
64.964
+0.338
0.52%
Ranking of countries by current statistics by years


Comments: