29
/
en
AIzaSyAYiBZKx7MnpbEhh9jyipgxe19OcubqV5w
April 1, 2024
193237
Mauritania
MRT
true
2
1
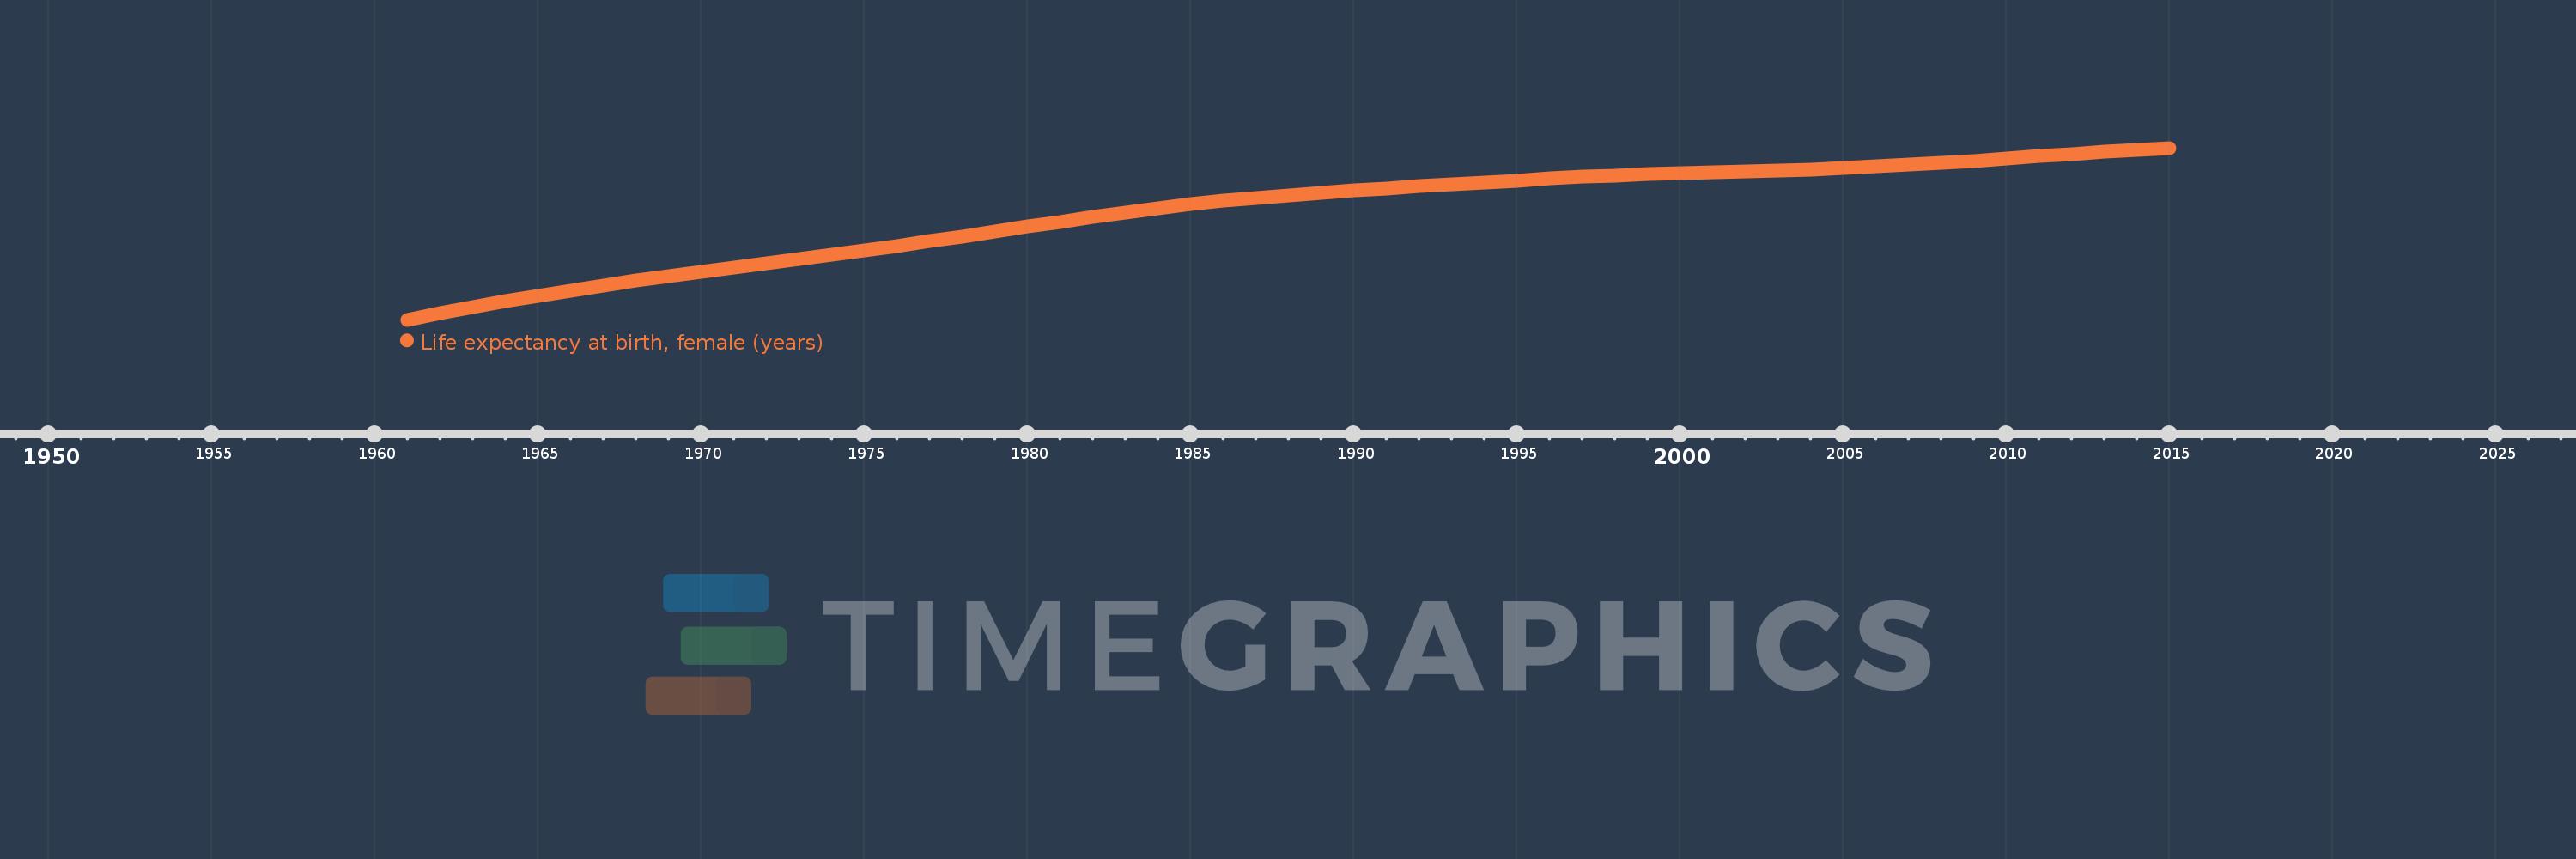
Life expectancy at birth, female (years)
2015,2014,2013,2012,2011,2010,2009,2008,2007,2006,2005,2004,2003,2002,2001,2000,1999,1998,1997,1996,1995,1994,1993,1992,1991,1990,1989,1988,1987,1986,1985,1984,1983,1982,1981,1980,1979,1978,1977,1976,1975,1974,1973,1972,1971,1970,1969,1968,1967,1966,1965,1964,1963,1962,1961
This statistics in other country:
AfghanistanAlbaniaAlgeriaAngolaAntigua and BarbudaArab WorldArgentinaArmeniaArubaAustraliaAustriaAzerbaijanBahamas, TheBahrainBangladeshBarbadosBelarusBelgiumBelizeBeninBermudaBhutanBoliviaBosnia and HerzegovinaBotswanaBrazilBrunei DarussalamBulgariaBurkina FasoBurundiCabo VerdeCambodiaCameroonCanadaCaribbean small statesCentral African RepublicCentral Europe and the BalticsChadChannel IslandsChileChinaColombiaComorosCongo, Dem. Rep.Congo, Rep.Costa RicaCote d'IvoireCroatiaCubaCuracaoCyprusCzech RepublicDenmarkDjiboutiDominicaDominican RepublicEarly-demographic dividendEast Asia & PacificEast Asia & Pacific (excluding high income)East Asia & Pacific (IDA & IBRD countries)EcuadorEgypt, Arab Rep.El SalvadorEquatorial GuineaEritreaEstoniaEthiopiaEuro areaEurope & Central AsiaEurope & Central Asia (excluding high income)Europe & Central Asia (IDA & IBRD countries)European UnionFaroe IslandsFijiFinlandFragile and conflict affected situationsFranceFrench PolynesiaGabonGambia, TheGeorgiaGermanyGhanaGreeceGreenlandGrenadaGuamGuatemalaGuineaGuinea-BissauGuyanaHaitiHeavily indebted poor countries (HIPC)High incomeHondurasHong Kong SAR, ChinaHungaryIBRD onlyIcelandIDA & IBRD totalIDA blendIDA onlyIDA totalIndiaIndonesiaIran, Islamic Rep.IraqIrelandIsle of ManIsraelItalyJamaicaJapanJordanKazakhstanKenyaKiribatiKorea, Dem. People’s Rep.Korea, Rep.KosovoKuwaitKyrgyz RepublicLao PDRLate-demographic dividendLatin America & Caribbean Latin America & Caribbean (excluding high income)Latin America & the Caribbean (IDA & IBRD countries)LatviaLeast developed countries: UN classificationLebanonLesothoLiberiaLibyaLiechtensteinLithuaniaLow & middle incomeLow incomeLower middle incomeLuxembourgMacao SAR, ChinaMacedonia, FYRMadagascarMalawiMalaysiaMaldivesMaliMaltaMarshall IslandsMauritaniaMauritiusMexicoMicronesia, Fed. Sts.Middle East & North AfricaMiddle East & North Africa (excluding high income)Middle East & North Africa (IDA & IBRD countries)Middle incomeMoldovaMongoliaMontenegroMoroccoMozambiqueMyanmarNamibiaNepalNetherlandsNew CaledoniaNew ZealandNicaraguaNigerNigeriaNorth AmericaNorwayOECD membersOmanOther small statesPacific island small statesPakistanPalauPanamaPapua New GuineaParaguayPeruPhilippinesPolandPortugalPost-demographic dividendPre-demographic dividendPuerto RicoQatarRomaniaRussian FederationRwandaSamoaSan MarinoSao Tome and PrincipeSaudi ArabiaSenegalSerbiaSeychellesSierra LeoneSingaporeSint Maarten (Dutch part)Slovak RepublicSloveniaSmall statesSolomon IslandsSomaliaSouth AfricaSouth AsiaSouth Asia (IDA & IBRD)South SudanSpainSri LankaSt. Kitts and NevisSt. LuciaSt. Martin (French part)St. Vincent and the GrenadinesSub-Saharan Africa Sub-Saharan Africa (excluding high income)Sub-Saharan Africa (IDA & IBRD countries)SudanSurinameSwazilandSwedenSwitzerlandSyrian Arab RepublicTajikistanTanzaniaThailandTimor-LesteTogoTongaTrinidad and TobagoTunisiaTurkeyTurkmenistanUgandaUkraineUnited Arab EmiratesUnited KingdomUnited StatesUpper middle incomeUruguayUzbekistanVanuatuVenezuela, RBVietnamVirgin Islands (U.S.)West Bank and GazaWorldYemen, Rep.ZambiaZimbabwe Timeline:
This timeline shows a graph from 1961 to 2015 of Mauritania. No data until 1960. Number of actual observations by date: 55.
Source name:
World Development Indicators
Source organization:
(1) United Nations Population Division. World Population Prospects, (2) Census reports and other statistical publications from national statistical offices, (3) Eurostat: Demographic Statistics, (4) United Nations Statistical Division. Population and Vital Statistics Reprot (various years), (5) U.S. Census Bureau: International Database, and (6) Secretariat of the Pacific Community: Statistics and Demography Programme.
Categories, topics:
Health, Gender, Social Development
Last updated:
apr 23, 2017
Indicators value changes by year
Maximum:
64.546
jan 1, 2015
At the date of observation
Value
Absolute change
Change from previous value
jan 1, 1961
43.92
+43.92
0.0%
jan 1, 1962
44.671
+0.751
1.71%
jan 1, 1963
45.404
+0.733
1.64%
jan 1, 1964
46.11
+0.706
1.55%
jan 1, 1965
46.783
+0.673
1.46%
jan 1, 1966
47.419
+0.636
1.36%
jan 1, 1967
48.018
+0.599
1.26%
jan 1, 1968
48.59
+0.572
1.19%
jan 1, 1969
49.141
+0.551
1.13%
jan 1, 1970
49.676
+0.535
1.09%
jan 1, 1971
50.201
+0.525
1.06%
jan 1, 1972
50.719
+0.518
1.03%
jan 1, 1973
51.233
+0.514
1.01%
jan 1, 1974
51.747
+0.514
1.0%
jan 1, 1975
52.266
+0.519
1.0%
jan 1, 1976
52.796
+0.53
1.01%
jan 1, 1977
53.345
+0.549
1.04%
jan 1, 1978
53.913
+0.568
1.06%
jan 1, 1979
54.496
+0.583
1.08%
jan 1, 1980
55.086
+0.59
1.08%
jan 1, 1981
55.673
+0.587
1.07%
jan 1, 1982
56.246
+0.573
1.03%
jan 1, 1983
56.791
+0.545
0.97%
jan 1, 1984
57.299
+0.508
0.89%
jan 1, 1985
57.764
+0.465
0.81%
jan 1, 1986
58.181
+0.417
0.72%
jan 1, 1987
58.549
+0.368
0.63%
jan 1, 1988
58.876
+0.327
0.56%
jan 1, 1989
59.171
+0.295
0.5%
jan 1, 1990
59.439
+0.268
0.45%
jan 1, 1991
59.69
+0.251
0.42%
jan 1, 1992
59.931
+0.241
0.4%
jan 1, 1993
60.17
+0.239
0.4%
jan 1, 1994
60.407
+0.237
0.39%
jan 1, 1995
60.642
+0.235
0.39%
jan 1, 1996
60.871
+0.229
0.38%
jan 1, 1997
61.082
+0.211
0.35%
jan 1, 1998
61.266
+0.184
0.3%
jan 1, 1999
61.421
+0.155
0.25%
jan 1, 2000
61.55
+0.129
0.21%
jan 1, 2001
61.66
+0.11
0.18%
jan 1, 2002
61.761
+0.101
0.16%
jan 1, 2003
61.866
+0.105
0.17%
jan 1, 2004
61.987
+0.121
0.2%
jan 1, 2005
62.13
+0.143
0.23%
jan 1, 2006
62.304
+0.174
0.28%
jan 1, 2007
62.511
+0.207
0.33%
jan 1, 2008
62.747
+0.236
0.38%
jan 1, 2009
63.004
+0.257
0.41%
jan 1, 2010
63.276
+0.272
0.43%
jan 1, 2011
63.553
+0.277
0.44%
jan 1, 2012
63.826
+0.273
0.43%
jan 1, 2013
64.086
+0.26
0.41%
jan 1, 2014
64.327
+0.241
0.38%
jan 1, 2015
64.546
+0.219
0.34%
Ranking of countries by current statistics by years


Comments: