29
/
en
AIzaSyAYiBZKx7MnpbEhh9jyipgxe19OcubqV5w
April 1, 2024
239513
Sierra Leone
SLE
true
2
1
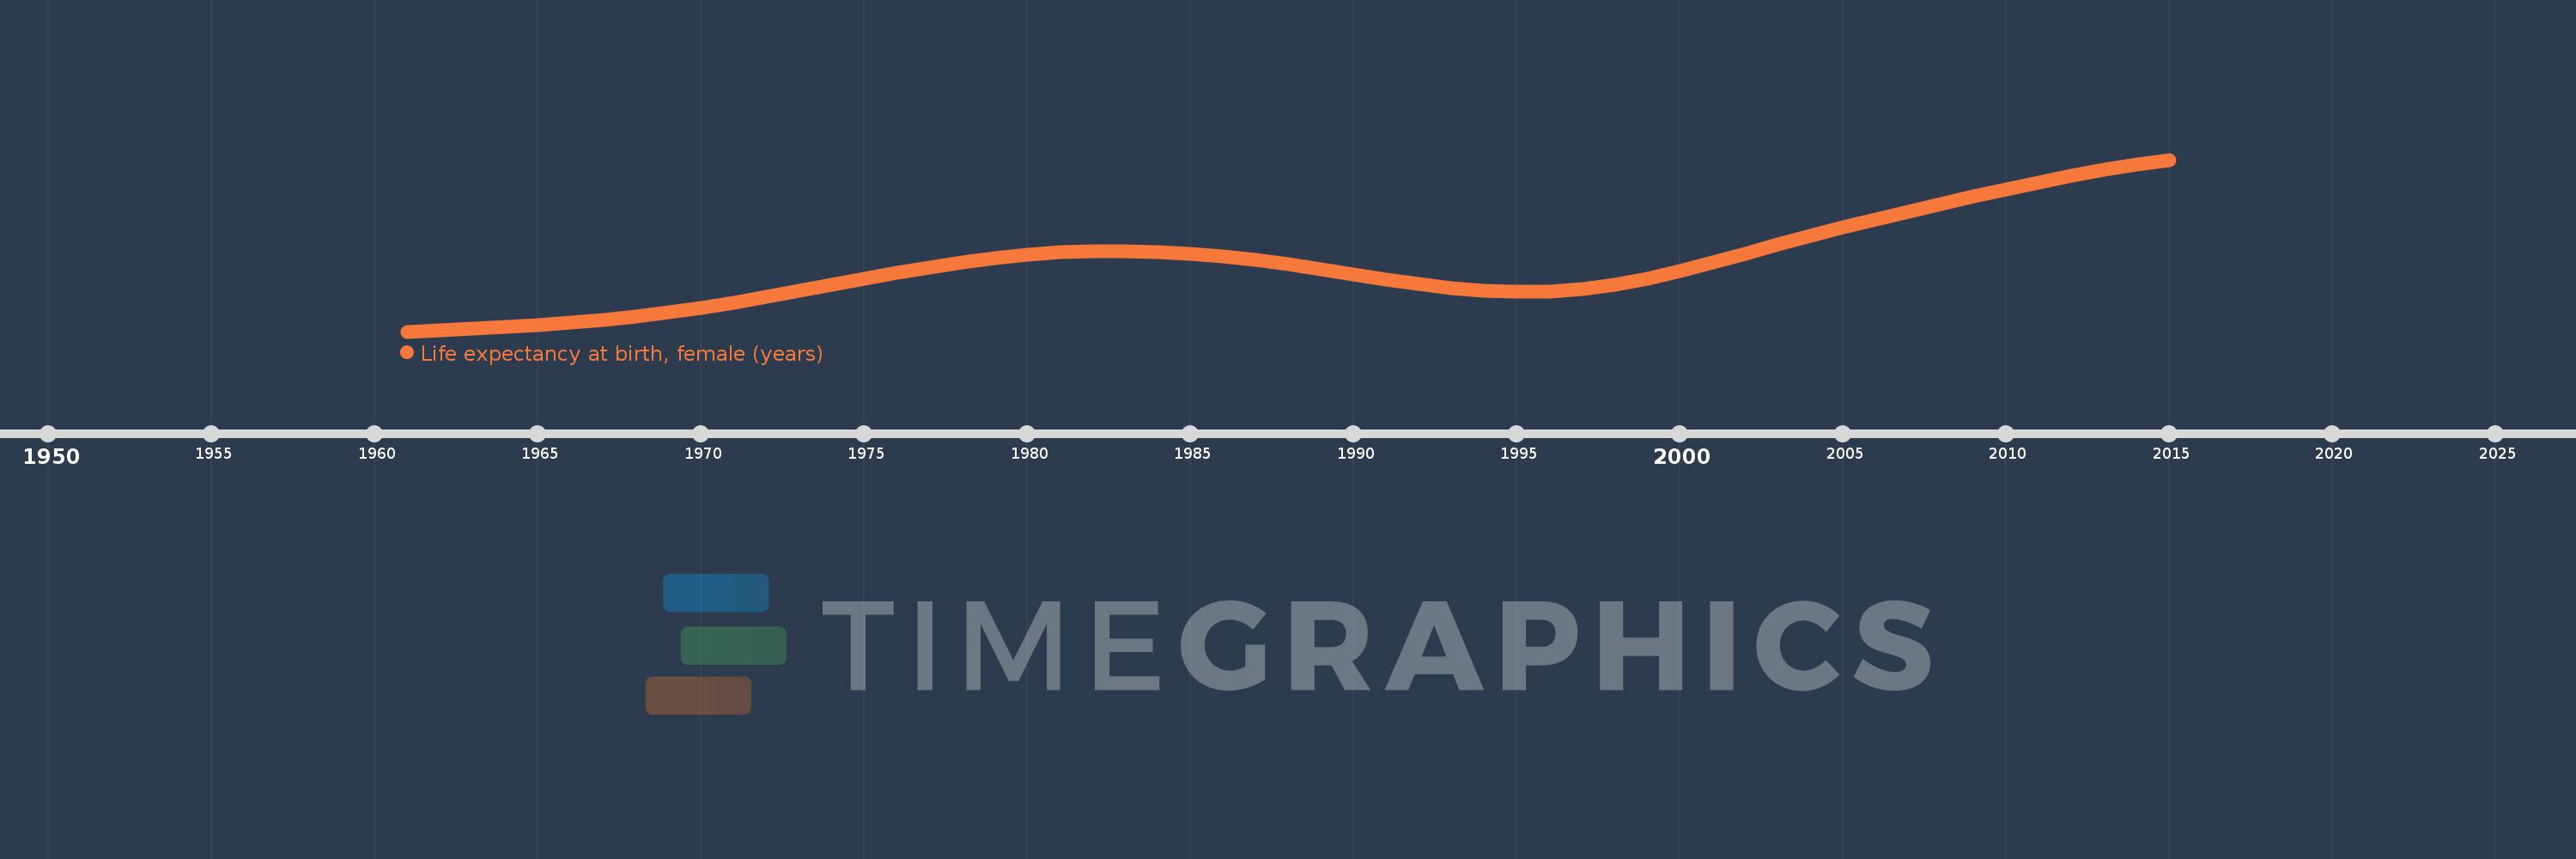
Life expectancy at birth, female (years)
2015,2014,2013,2012,2011,2010,2009,2008,2007,2006,2005,2004,2003,2002,2001,2000,1999,1998,1997,1996,1995,1994,1993,1992,1991,1990,1989,1988,1987,1986,1985,1984,1983,1982,1981,1980,1979,1978,1977,1976,1975,1974,1973,1972,1971,1970,1969,1968,1967,1966,1965,1964,1963,1962,1961
This statistics in other country:
AfghanistanAlbaniaAlgeriaAngolaAntigua and BarbudaArab WorldArgentinaArmeniaArubaAustraliaAustriaAzerbaijanBahamas, TheBahrainBangladeshBarbadosBelarusBelgiumBelizeBeninBermudaBhutanBoliviaBosnia and HerzegovinaBotswanaBrazilBrunei DarussalamBulgariaBurkina FasoBurundiCabo VerdeCambodiaCameroonCanadaCaribbean small statesCentral African RepublicCentral Europe and the BalticsChadChannel IslandsChileChinaColombiaComorosCongo, Dem. Rep.Congo, Rep.Costa RicaCote d'IvoireCroatiaCubaCuracaoCyprusCzech RepublicDenmarkDjiboutiDominicaDominican RepublicEarly-demographic dividendEast Asia & PacificEast Asia & Pacific (excluding high income)East Asia & Pacific (IDA & IBRD countries)EcuadorEgypt, Arab Rep.El SalvadorEquatorial GuineaEritreaEstoniaEthiopiaEuro areaEurope & Central AsiaEurope & Central Asia (excluding high income)Europe & Central Asia (IDA & IBRD countries)European UnionFaroe IslandsFijiFinlandFragile and conflict affected situationsFranceFrench PolynesiaGabonGambia, TheGeorgiaGermanyGhanaGreeceGreenlandGrenadaGuamGuatemalaGuineaGuinea-BissauGuyanaHaitiHeavily indebted poor countries (HIPC)High incomeHondurasHong Kong SAR, ChinaHungaryIBRD onlyIcelandIDA & IBRD totalIDA blendIDA onlyIDA totalIndiaIndonesiaIran, Islamic Rep.IraqIrelandIsle of ManIsraelItalyJamaicaJapanJordanKazakhstanKenyaKiribatiKorea, Dem. People’s Rep.Korea, Rep.KosovoKuwaitKyrgyz RepublicLao PDRLate-demographic dividendLatin America & Caribbean Latin America & Caribbean (excluding high income)Latin America & the Caribbean (IDA & IBRD countries)LatviaLeast developed countries: UN classificationLebanonLesothoLiberiaLibyaLiechtensteinLithuaniaLow & middle incomeLow incomeLower middle incomeLuxembourgMacao SAR, ChinaMacedonia, FYRMadagascarMalawiMalaysiaMaldivesMaliMaltaMarshall IslandsMauritaniaMauritiusMexicoMicronesia, Fed. Sts.Middle East & North AfricaMiddle East & North Africa (excluding high income)Middle East & North Africa (IDA & IBRD countries)Middle incomeMoldovaMongoliaMontenegroMoroccoMozambiqueMyanmarNamibiaNepalNetherlandsNew CaledoniaNew ZealandNicaraguaNigerNigeriaNorth AmericaNorwayOECD membersOmanOther small statesPacific island small statesPakistanPalauPanamaPapua New GuineaParaguayPeruPhilippinesPolandPortugalPost-demographic dividendPre-demographic dividendPuerto RicoQatarRomaniaRussian FederationRwandaSamoaSan MarinoSao Tome and PrincipeSaudi ArabiaSenegalSerbiaSeychellesSierra LeoneSingaporeSint Maarten (Dutch part)Slovak RepublicSloveniaSmall statesSolomon IslandsSomaliaSouth AfricaSouth AsiaSouth Asia (IDA & IBRD)South SudanSpainSri LankaSt. Kitts and NevisSt. LuciaSt. Martin (French part)St. Vincent and the GrenadinesSub-Saharan Africa Sub-Saharan Africa (excluding high income)Sub-Saharan Africa (IDA & IBRD countries)SudanSurinameSwazilandSwedenSwitzerlandSyrian Arab RepublicTajikistanTanzaniaThailandTimor-LesteTogoTongaTrinidad and TobagoTunisiaTurkeyTurkmenistanUgandaUkraineUnited Arab EmiratesUnited KingdomUnited StatesUpper middle incomeUruguayUzbekistanVanuatuVenezuela, RBVietnamVirgin Islands (U.S.)West Bank and GazaWorldYemen, Rep.ZambiaZimbabwe Timeline:
This timeline shows a graph from 1961 to 2015 of Sierra Leone. No data until 1960. Number of actual observations by date: 55.
Source name:
World Development Indicators
Source organization:
(1) United Nations Population Division. World Population Prospects, (2) Census reports and other statistical publications from national statistical offices, (3) Eurostat: Demographic Statistics, (4) United Nations Statistical Division. Population and Vital Statistics Reprot (various years), (5) U.S. Census Bureau: International Database, and (6) Secretariat of the Pacific Community: Statistics and Demography Programme.
Categories, topics:
Health, Gender, Social Development
Last updated:
apr 23, 2017
Indicators value changes by year
Minimum:
31.968
jan 1, 1961
Maximum:
51.434
jan 1, 2015
At the date of observation
Value
Absolute change
Change from previous value
jan 1, 1961
31.968
+31.968
0.0%
jan 1, 1962
32.139
+0.171
0.53%
jan 1, 1963
32.316
+0.177
0.55%
jan 1, 1964
32.508
+0.192
0.59%
jan 1, 1965
32.726
+0.218
0.67%
jan 1, 1966
32.986
+0.26
0.79%
jan 1, 1967
33.304
+0.318
0.96%
jan 1, 1968
33.688
+0.384
1.15%
jan 1, 1969
34.139
+0.451
1.34%
jan 1, 1970
34.655
+0.516
1.51%
jan 1, 1971
35.235
+0.58
1.67%
jan 1, 1972
35.876
+0.641
1.82%
jan 1, 1973
36.558
+0.682
1.9%
jan 1, 1974
37.258
+0.7
1.91%
jan 1, 1975
37.951
+0.693
1.86%
jan 1, 1976
38.616
+0.665
1.75%
jan 1, 1977
39.235
+0.619
1.6%
jan 1, 1978
39.792
+0.557
1.42%
jan 1, 1979
40.274
+0.482
1.21%
jan 1, 1980
40.661
+0.387
0.96%
jan 1, 1981
40.934
+0.273
0.67%
jan 1, 1982
41.082
+0.148
0.36%
jan 1, 1983
41.107
+0.025
0.06%
jan 1, 1984
41.019
-0.088
-0.21%
jan 1, 1985
40.825
-0.194
-0.47%
jan 1, 1986
40.522
-0.303
-0.74%
jan 1, 1987
40.106
-0.416
-1.03%
jan 1, 1988
39.597
-0.509
-1.27%
jan 1, 1989
39.027
-0.57
-1.44%
jan 1, 1990
38.435
-0.592
-1.52%
jan 1, 1991
37.861
-0.574
-1.49%
jan 1, 1992
37.343
-0.518
-1.37%
jan 1, 1993
36.915
-0.428
-1.15%
jan 1, 1994
36.61
-0.305
-0.83%
jan 1, 1995
36.462
-0.148
-0.4%
jan 1, 1996
36.511
+0.049
0.13%
jan 1, 1997
36.787
+0.276
0.76%
jan 1, 1998
37.279
+0.492
1.34%
jan 1, 1999
37.958
+0.679
1.82%
jan 1, 2000
38.798
+0.84
2.21%
jan 1, 2001
39.755
+0.957
2.47%
jan 1, 2002
40.78
+1.025
2.58%
jan 1, 2003
41.823
+1.043
2.56%
jan 1, 2004
42.841
+1.018
2.43%
jan 1, 2005
43.807
+0.966
2.25%
jan 1, 2006
44.713
+0.906
2.07%
jan 1, 2007
45.574
+0.861
1.93%
jan 1, 2008
46.418
+0.844
1.85%
jan 1, 2009
47.262
+0.844
1.82%
jan 1, 2010
48.097
+0.835
1.77%
jan 1, 2011
48.903
+0.806
1.68%
jan 1, 2012
49.655
+0.752
1.54%
jan 1, 2013
50.333
+0.678
1.37%
jan 1, 2014
50.925
+0.592
1.18%
jan 1, 2015
51.434
+0.509
1.0%
Ranking of countries by current statistics by years


Comments: