29
/
en
AIzaSyAYiBZKx7MnpbEhh9jyipgxe19OcubqV5w
April 1, 2024
100145
Cameroon
CMR
true
2
1
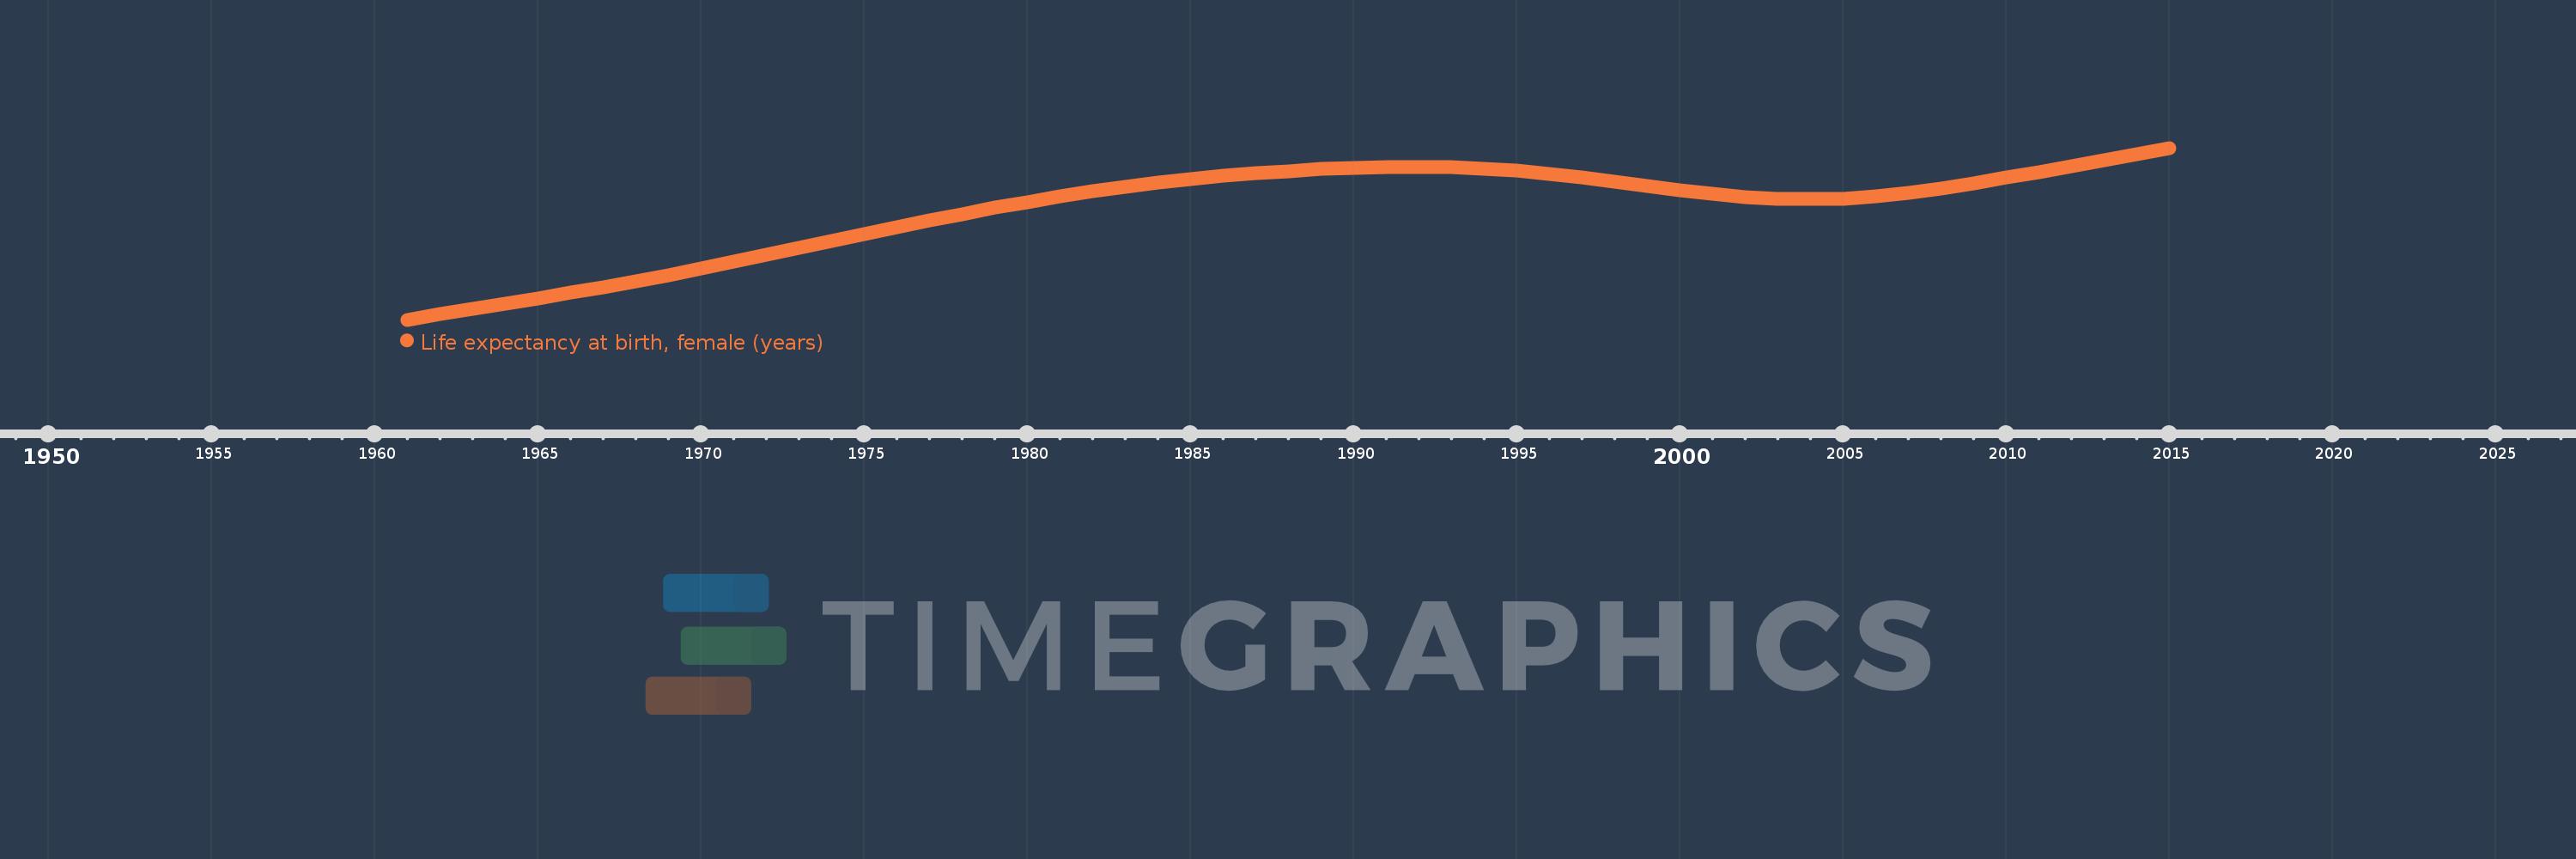
Life expectancy at birth, female (years)
2015,2014,2013,2012,2011,2010,2009,2008,2007,2006,2005,2004,2003,2002,2001,2000,1999,1998,1997,1996,1995,1994,1993,1992,1991,1990,1989,1988,1987,1986,1985,1984,1983,1982,1981,1980,1979,1978,1977,1976,1975,1974,1973,1972,1971,1970,1969,1968,1967,1966,1965,1964,1963,1962,1961
This statistics in other country:
AfghanistanAlbaniaAlgeriaAngolaAntigua and BarbudaArab WorldArgentinaArmeniaArubaAustraliaAustriaAzerbaijanBahamas, TheBahrainBangladeshBarbadosBelarusBelgiumBelizeBeninBermudaBhutanBoliviaBosnia and HerzegovinaBotswanaBrazilBrunei DarussalamBulgariaBurkina FasoBurundiCabo VerdeCambodiaCameroonCanadaCaribbean small statesCentral African RepublicCentral Europe and the BalticsChadChannel IslandsChileChinaColombiaComorosCongo, Dem. Rep.Congo, Rep.Costa RicaCote d'IvoireCroatiaCubaCuracaoCyprusCzech RepublicDenmarkDjiboutiDominicaDominican RepublicEarly-demographic dividendEast Asia & PacificEast Asia & Pacific (excluding high income)East Asia & Pacific (IDA & IBRD countries)EcuadorEgypt, Arab Rep.El SalvadorEquatorial GuineaEritreaEstoniaEthiopiaEuro areaEurope & Central AsiaEurope & Central Asia (excluding high income)Europe & Central Asia (IDA & IBRD countries)European UnionFaroe IslandsFijiFinlandFragile and conflict affected situationsFranceFrench PolynesiaGabonGambia, TheGeorgiaGermanyGhanaGreeceGreenlandGrenadaGuamGuatemalaGuineaGuinea-BissauGuyanaHaitiHeavily indebted poor countries (HIPC)High incomeHondurasHong Kong SAR, ChinaHungaryIBRD onlyIcelandIDA & IBRD totalIDA blendIDA onlyIDA totalIndiaIndonesiaIran, Islamic Rep.IraqIrelandIsle of ManIsraelItalyJamaicaJapanJordanKazakhstanKenyaKiribatiKorea, Dem. People’s Rep.Korea, Rep.KosovoKuwaitKyrgyz RepublicLao PDRLate-demographic dividendLatin America & Caribbean Latin America & Caribbean (excluding high income)Latin America & the Caribbean (IDA & IBRD countries)LatviaLeast developed countries: UN classificationLebanonLesothoLiberiaLibyaLiechtensteinLithuaniaLow & middle incomeLow incomeLower middle incomeLuxembourgMacao SAR, ChinaMacedonia, FYRMadagascarMalawiMalaysiaMaldivesMaliMaltaMarshall IslandsMauritaniaMauritiusMexicoMicronesia, Fed. Sts.Middle East & North AfricaMiddle East & North Africa (excluding high income)Middle East & North Africa (IDA & IBRD countries)Middle incomeMoldovaMongoliaMontenegroMoroccoMozambiqueMyanmarNamibiaNepalNetherlandsNew CaledoniaNew ZealandNicaraguaNigerNigeriaNorth AmericaNorwayOECD membersOmanOther small statesPacific island small statesPakistanPalauPanamaPapua New GuineaParaguayPeruPhilippinesPolandPortugalPost-demographic dividendPre-demographic dividendPuerto RicoQatarRomaniaRussian FederationRwandaSamoaSan MarinoSao Tome and PrincipeSaudi ArabiaSenegalSerbiaSeychellesSierra LeoneSingaporeSint Maarten (Dutch part)Slovak RepublicSloveniaSmall statesSolomon IslandsSomaliaSouth AfricaSouth AsiaSouth Asia (IDA & IBRD)South SudanSpainSri LankaSt. Kitts and NevisSt. LuciaSt. Martin (French part)St. Vincent and the GrenadinesSub-Saharan Africa Sub-Saharan Africa (excluding high income)Sub-Saharan Africa (IDA & IBRD countries)SudanSurinameSwazilandSwedenSwitzerlandSyrian Arab RepublicTajikistanTanzaniaThailandTimor-LesteTogoTongaTrinidad and TobagoTunisiaTurkeyTurkmenistanUgandaUkraineUnited Arab EmiratesUnited KingdomUnited StatesUpper middle incomeUruguayUzbekistanVanuatuVenezuela, RBVietnamVirgin Islands (U.S.)West Bank and GazaWorldYemen, Rep.ZambiaZimbabwe Timeline:
This timeline shows a graph from 1961 to 2015 of Cameroon. No data until 1960. Number of actual observations by date: 55.
Source name:
World Development Indicators
Source organization:
(1) United Nations Population Division. World Population Prospects, (2) Census reports and other statistical publications from national statistical offices, (3) Eurostat: Demographic Statistics, (4) United Nations Statistical Division. Population and Vital Statistics Reprot (various years), (5) U.S. Census Bureau: International Database, and (6) Secretariat of the Pacific Community: Statistics and Demography Programme.
Categories, topics:
Health, Gender, Social Development
Last updated:
apr 23, 2017
Indicators value changes by year
Minimum:
42.878
jan 1, 1961
Maximum:
56.679
jan 1, 2015
At the date of observation
Value
Absolute change
Change from previous value
jan 1, 1961
42.878
+42.878
0.0%
jan 1, 1962
43.316
+0.438
1.02%
jan 1, 1963
43.752
+0.436
1.01%
jan 1, 1964
44.185
+0.433
0.99%
jan 1, 1965
44.616
+0.431
0.98%
jan 1, 1966
45.052
+0.436
0.98%
jan 1, 1967
45.502
+0.45
1.0%
jan 1, 1968
45.973
+0.471
1.04%
jan 1, 1969
46.468
+0.495
1.08%
jan 1, 1970
46.988
+0.52
1.12%
jan 1, 1971
47.53
+0.542
1.15%
jan 1, 1972
48.09
+0.56
1.18%
jan 1, 1973
48.657
+0.567
1.18%
jan 1, 1974
49.223
+0.566
1.16%
jan 1, 1975
49.781
+0.558
1.13%
jan 1, 1976
50.326
+0.545
1.09%
jan 1, 1977
50.856
+0.53
1.05%
jan 1, 1978
51.371
+0.515
1.01%
jan 1, 1979
51.866
+0.495
0.96%
jan 1, 1980
52.338
+0.472
0.91%
jan 1, 1981
52.781
+0.443
0.85%
jan 1, 1982
53.188
+0.407
0.77%
jan 1, 1983
53.558
+0.37
0.7%
jan 1, 1984
53.889
+0.331
0.62%
jan 1, 1985
54.179
+0.29
0.54%
jan 1, 1986
54.429
+0.25
0.46%
jan 1, 1987
54.643
+0.214
0.39%
jan 1, 1988
54.825
+0.182
0.33%
jan 1, 1989
54.974
+0.149
0.27%
jan 1, 1990
55.087
+0.113
0.21%
jan 1, 1991
55.155
+0.068
0.12%
jan 1, 1992
55.167
+0.012
0.02%
jan 1, 1993
55.116
-0.051
-0.09%
jan 1, 1994
55.002
-0.114
-0.21%
jan 1, 1995
54.83
-0.172
-0.31%
jan 1, 1996
54.6
-0.23
-0.42%
jan 1, 1997
54.312
-0.288
-0.53%
jan 1, 1998
53.982
-0.33
-0.61%
jan 1, 1999
53.634
-0.348
-0.64%
jan 1, 2000
53.293
-0.341
-0.64%
jan 1, 2001
52.991
-0.302
-0.57%
jan 1, 2002
52.757
-0.234
-0.44%
jan 1, 2003
52.61
-0.147
-0.28%
jan 1, 2004
52.561
-0.049
-0.09%
jan 1, 2005
52.62
+0.059
0.11%
jan 1, 2006
52.79
+0.17
0.32%
jan 1, 2007
53.064
+0.274
0.52%
jan 1, 2008
53.418
+0.354
0.67%
jan 1, 2009
53.829
+0.411
0.77%
jan 1, 2010
54.279
+0.45
0.84%
jan 1, 2011
54.752
+0.473
0.87%
jan 1, 2012
55.235
+0.483
0.88%
jan 1, 2013
55.721
+0.486
0.88%
jan 1, 2014
56.205
+0.484
0.87%
jan 1, 2015
56.679
+0.474
0.84%
Ranking of countries by current statistics by years


Comments: