29
/
en
AIzaSyAYiBZKx7MnpbEhh9jyipgxe19OcubqV5w
April 1, 2024
134933
French Polynesia
PYF
true
2
1
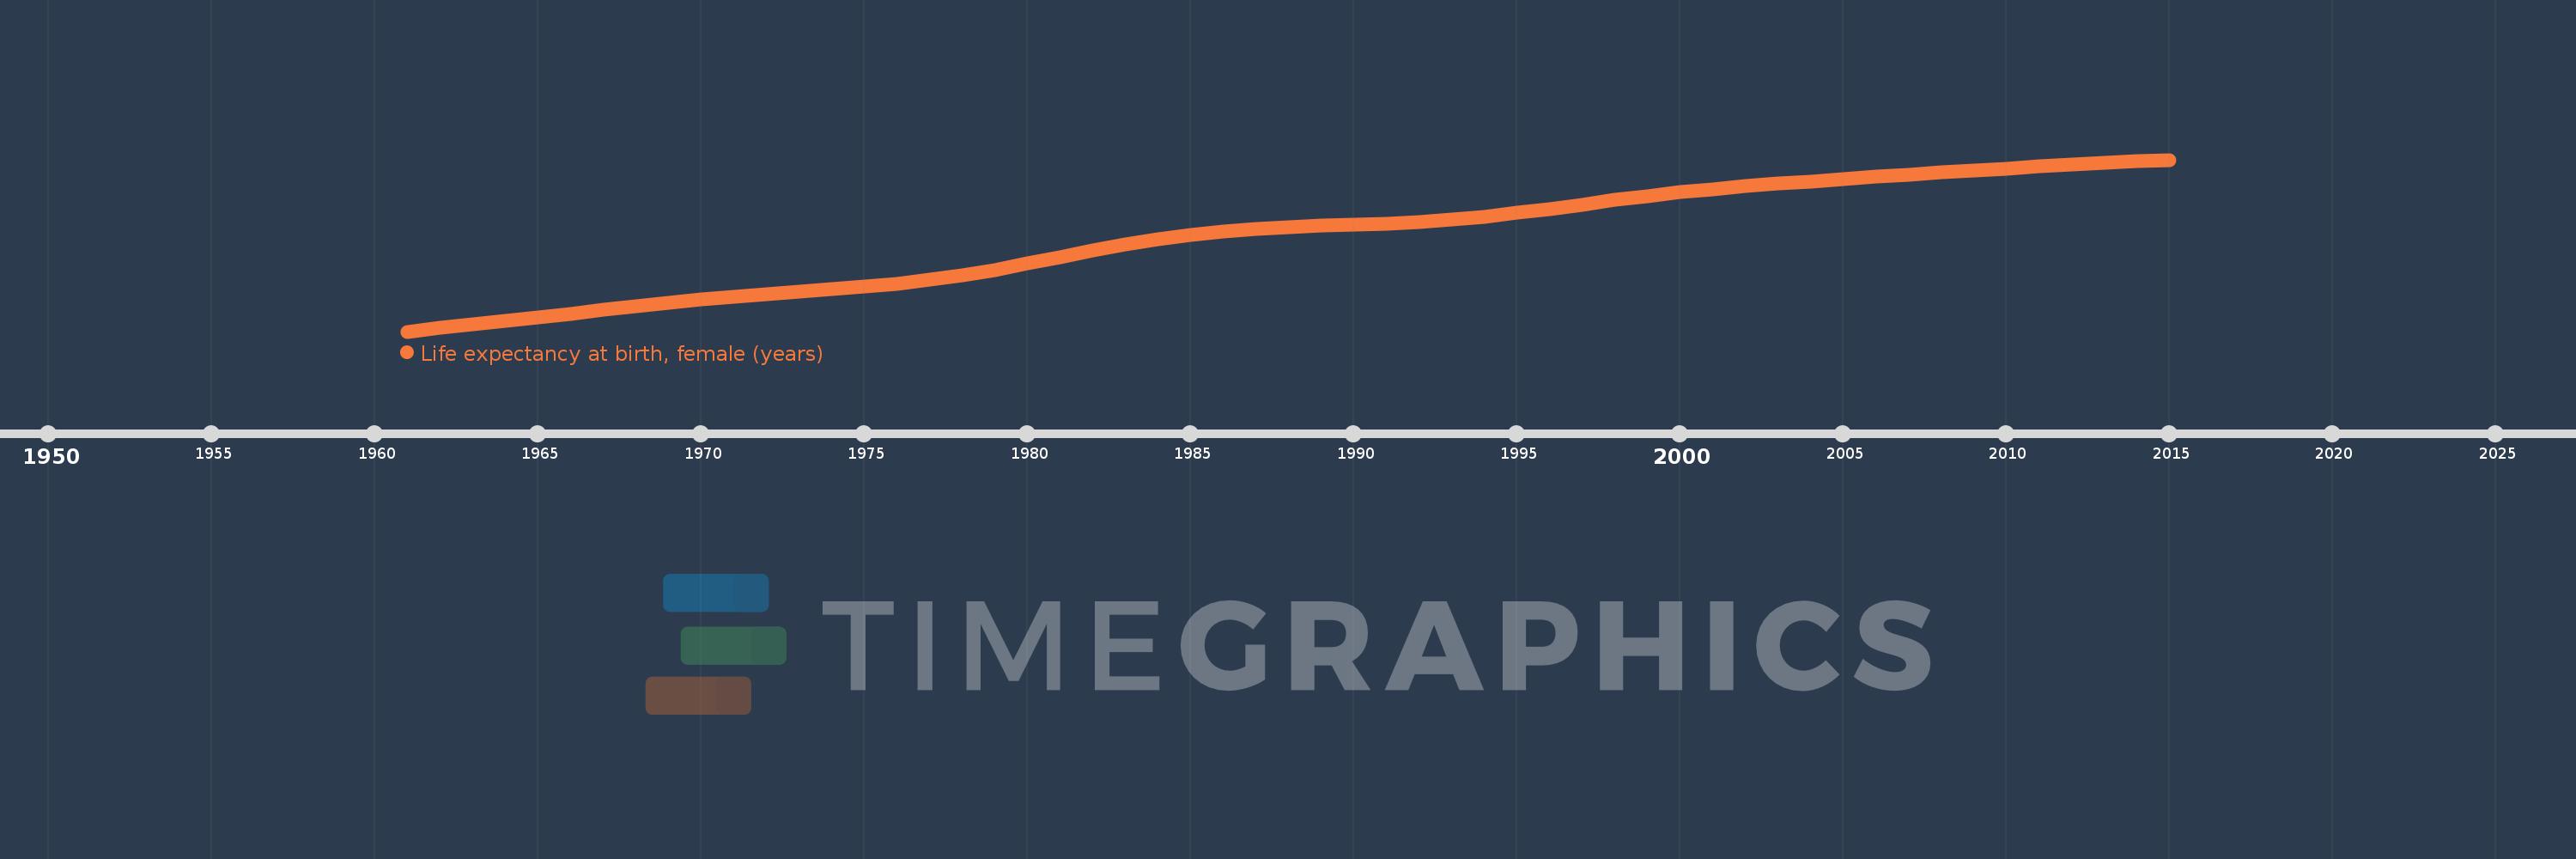
Life expectancy at birth, female (years)
2015,2014,2013,2012,2011,2010,2009,2008,2007,2006,2005,2004,2003,2002,2001,2000,1999,1998,1997,1996,1995,1994,1993,1992,1991,1990,1989,1988,1987,1986,1985,1984,1983,1982,1981,1980,1979,1978,1977,1976,1975,1974,1973,1972,1971,1970,1969,1968,1967,1966,1965,1964,1963,1962,1961
This statistics in other country:
AfghanistanAlbaniaAlgeriaAngolaAntigua and BarbudaArab WorldArgentinaArmeniaArubaAustraliaAustriaAzerbaijanBahamas, TheBahrainBangladeshBarbadosBelarusBelgiumBelizeBeninBermudaBhutanBoliviaBosnia and HerzegovinaBotswanaBrazilBrunei DarussalamBulgariaBurkina FasoBurundiCabo VerdeCambodiaCameroonCanadaCaribbean small statesCentral African RepublicCentral Europe and the BalticsChadChannel IslandsChileChinaColombiaComorosCongo, Dem. Rep.Congo, Rep.Costa RicaCote d'IvoireCroatiaCubaCuracaoCyprusCzech RepublicDenmarkDjiboutiDominicaDominican RepublicEarly-demographic dividendEast Asia & PacificEast Asia & Pacific (excluding high income)East Asia & Pacific (IDA & IBRD countries)EcuadorEgypt, Arab Rep.El SalvadorEquatorial GuineaEritreaEstoniaEthiopiaEuro areaEurope & Central AsiaEurope & Central Asia (excluding high income)Europe & Central Asia (IDA & IBRD countries)European UnionFaroe IslandsFijiFinlandFragile and conflict affected situationsFranceFrench PolynesiaGabonGambia, TheGeorgiaGermanyGhanaGreeceGreenlandGrenadaGuamGuatemalaGuineaGuinea-BissauGuyanaHaitiHeavily indebted poor countries (HIPC)High incomeHondurasHong Kong SAR, ChinaHungaryIBRD onlyIcelandIDA & IBRD totalIDA blendIDA onlyIDA totalIndiaIndonesiaIran, Islamic Rep.IraqIrelandIsle of ManIsraelItalyJamaicaJapanJordanKazakhstanKenyaKiribatiKorea, Dem. People’s Rep.Korea, Rep.KosovoKuwaitKyrgyz RepublicLao PDRLate-demographic dividendLatin America & Caribbean Latin America & Caribbean (excluding high income)Latin America & the Caribbean (IDA & IBRD countries)LatviaLeast developed countries: UN classificationLebanonLesothoLiberiaLibyaLiechtensteinLithuaniaLow & middle incomeLow incomeLower middle incomeLuxembourgMacao SAR, ChinaMacedonia, FYRMadagascarMalawiMalaysiaMaldivesMaliMaltaMarshall IslandsMauritaniaMauritiusMexicoMicronesia, Fed. Sts.Middle East & North AfricaMiddle East & North Africa (excluding high income)Middle East & North Africa (IDA & IBRD countries)Middle incomeMoldovaMongoliaMontenegroMoroccoMozambiqueMyanmarNamibiaNepalNetherlandsNew CaledoniaNew ZealandNicaraguaNigerNigeriaNorth AmericaNorwayOECD membersOmanOther small statesPacific island small statesPakistanPalauPanamaPapua New GuineaParaguayPeruPhilippinesPolandPortugalPost-demographic dividendPre-demographic dividendPuerto RicoQatarRomaniaRussian FederationRwandaSamoaSan MarinoSao Tome and PrincipeSaudi ArabiaSenegalSerbiaSeychellesSierra LeoneSingaporeSint Maarten (Dutch part)Slovak RepublicSloveniaSmall statesSolomon IslandsSomaliaSouth AfricaSouth AsiaSouth Asia (IDA & IBRD)South SudanSpainSri LankaSt. Kitts and NevisSt. LuciaSt. Martin (French part)St. Vincent and the GrenadinesSub-Saharan Africa Sub-Saharan Africa (excluding high income)Sub-Saharan Africa (IDA & IBRD countries)SudanSurinameSwazilandSwedenSwitzerlandSyrian Arab RepublicTajikistanTanzaniaThailandTimor-LesteTogoTongaTrinidad and TobagoTunisiaTurkeyTurkmenistanUgandaUkraineUnited Arab EmiratesUnited KingdomUnited StatesUpper middle incomeUruguayUzbekistanVanuatuVenezuela, RBVietnamVirgin Islands (U.S.)West Bank and GazaWorldYemen, Rep.ZambiaZimbabwe Timeline:
This timeline shows a graph from 1961 to 2015 of French Polynesia. No data until 1960. Number of actual observations by date: 55.
Source name:
World Development Indicators
Source organization:
(1) United Nations Population Division. World Population Prospects, (2) Census reports and other statistical publications from national statistical offices, (3) Eurostat: Demographic Statistics, (4) United Nations Statistical Division. Population and Vital Statistics Reprot (various years), (5) U.S. Census Bureau: International Database, and (6) Secretariat of the Pacific Community: Statistics and Demography Programme.
Categories, topics:
Health, Gender, Social Development
Last updated:
apr 23, 2017
Indicators value changes by year
Minimum:
57.888
jan 1, 1961
Maximum:
78.865
jan 1, 2015
At the date of observation
Value
Absolute change
Change from previous value
jan 1, 1961
57.888
+57.888
0.0%
jan 1, 1962
58.354
+0.466
0.81%
jan 1, 1963
58.781
+0.427
0.73%
jan 1, 1964
59.202
+0.421
0.72%
jan 1, 1965
59.636
+0.434
0.73%
jan 1, 1966
60.087
+0.451
0.76%
jan 1, 1967
60.547
+0.46
0.77%
jan 1, 1968
60.992
+0.445
0.73%
jan 1, 1969
61.405
+0.413
0.68%
jan 1, 1970
61.788
+0.383
0.62%
jan 1, 1971
62.139
+0.351
0.57%
jan 1, 1972
62.459
+0.32
0.51%
jan 1, 1973
62.759
+0.3
0.48%
jan 1, 1974
63.058
+0.299
0.48%
jan 1, 1975
63.374
+0.316
0.5%
jan 1, 1976
63.743
+0.369
0.58%
jan 1, 1977
64.203
+0.46
0.72%
jan 1, 1978
64.766
+0.563
0.88%
jan 1, 1979
65.429
+0.663
1.02%
jan 1, 1980
66.176
+0.747
1.14%
jan 1, 1981
66.971
+0.795
1.2%
jan 1, 1982
67.767
+0.796
1.19%
jan 1, 1983
68.513
+0.746
1.1%
jan 1, 1984
69.171
+0.658
0.96%
jan 1, 1985
69.72
+0.549
0.79%
jan 1, 1986
70.145
+0.425
0.61%
jan 1, 1987
70.446
+0.301
0.43%
jan 1, 1988
70.656
+0.21
0.3%
jan 1, 1989
70.813
+0.157
0.22%
jan 1, 1990
70.946
+0.133
0.19%
jan 1, 1991
71.092
+0.146
0.21%
jan 1, 1992
71.293
+0.201
0.28%
jan 1, 1993
71.568
+0.275
0.39%
jan 1, 1994
71.924
+0.356
0.5%
jan 1, 1995
72.363
+0.439
0.61%
jan 1, 1996
72.866
+0.503
0.7%
jan 1, 1997
73.406
+0.54
0.74%
jan 1, 1998
73.941
+0.535
0.73%
jan 1, 1999
74.441
+0.5
0.68%
jan 1, 2000
74.891
+0.45
0.6%
jan 1, 2001
75.285
+0.394
0.53%
jan 1, 2002
75.628
+0.343
0.46%
jan 1, 2003
75.94
+0.312
0.41%
jan 1, 2004
76.238
+0.298
0.39%
jan 1, 2005
76.524
+0.286
0.38%
jan 1, 2006
76.802
+0.278
0.36%
jan 1, 2007
77.071
+0.269
0.35%
jan 1, 2008
77.329
+0.258
0.33%
jan 1, 2009
77.574
+0.245
0.32%
jan 1, 2010
77.807
+0.233
0.3%
jan 1, 2011
78.031
+0.224
0.29%
jan 1, 2012
78.247
+0.216
0.28%
jan 1, 2013
78.457
+0.21
0.27%
jan 1, 2014
78.662
+0.205
0.26%
jan 1, 2015
78.865
+0.203
0.26%
Ranking of countries by current statistics by years


Comments: