29
/
en
AIzaSyAYiBZKx7MnpbEhh9jyipgxe19OcubqV5w
April 1, 2024
29232
East Asia & Pacific (IDA & IBRD countries)
TEA
false
2
1
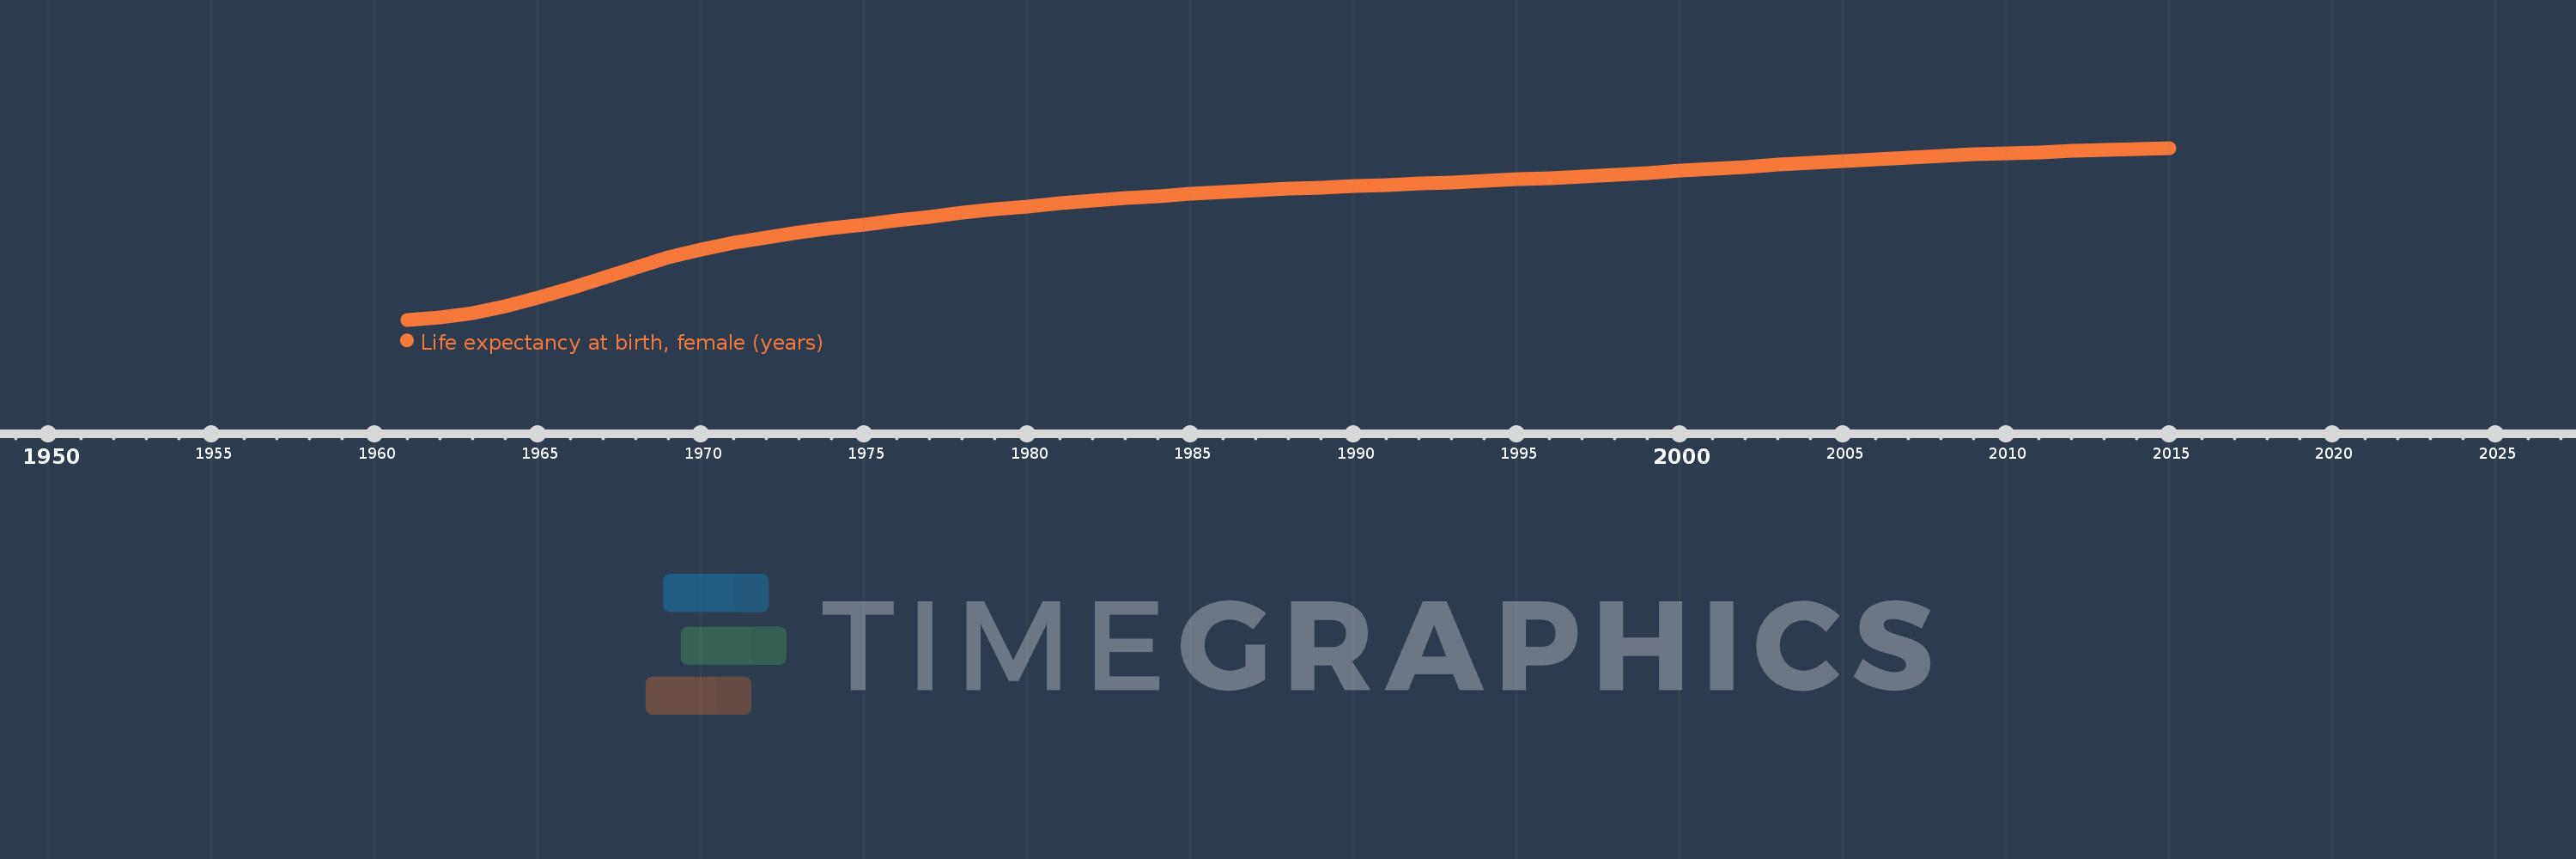
Life expectancy at birth, female (years)
2015,2014,2013,2012,2011,2010,2009,2008,2007,2006,2005,2004,2003,2002,2001,2000,1999,1998,1997,1996,1995,1994,1993,1992,1991,1990,1989,1988,1987,1986,1985,1984,1983,1982,1981,1980,1979,1978,1977,1976,1975,1974,1973,1972,1971,1970,1969,1968,1967,1966,1965,1964,1963,1962,1961
This statistics in other country:
AfghanistanAlbaniaAlgeriaAngolaAntigua and BarbudaArab WorldArgentinaArmeniaArubaAustraliaAustriaAzerbaijanBahamas, TheBahrainBangladeshBarbadosBelarusBelgiumBelizeBeninBermudaBhutanBoliviaBosnia and HerzegovinaBotswanaBrazilBrunei DarussalamBulgariaBurkina FasoBurundiCabo VerdeCambodiaCameroonCanadaCaribbean small statesCentral African RepublicCentral Europe and the BalticsChadChannel IslandsChileChinaColombiaComorosCongo, Dem. Rep.Congo, Rep.Costa RicaCote d'IvoireCroatiaCubaCuracaoCyprusCzech RepublicDenmarkDjiboutiDominicaDominican RepublicEarly-demographic dividendEast Asia & PacificEast Asia & Pacific (excluding high income)East Asia & Pacific (IDA & IBRD countries)EcuadorEgypt, Arab Rep.El SalvadorEquatorial GuineaEritreaEstoniaEthiopiaEuro areaEurope & Central AsiaEurope & Central Asia (excluding high income)Europe & Central Asia (IDA & IBRD countries)European UnionFaroe IslandsFijiFinlandFragile and conflict affected situationsFranceFrench PolynesiaGabonGambia, TheGeorgiaGermanyGhanaGreeceGreenlandGrenadaGuamGuatemalaGuineaGuinea-BissauGuyanaHaitiHeavily indebted poor countries (HIPC)High incomeHondurasHong Kong SAR, ChinaHungaryIBRD onlyIcelandIDA & IBRD totalIDA blendIDA onlyIDA totalIndiaIndonesiaIran, Islamic Rep.IraqIrelandIsle of ManIsraelItalyJamaicaJapanJordanKazakhstanKenyaKiribatiKorea, Dem. People’s Rep.Korea, Rep.KosovoKuwaitKyrgyz RepublicLao PDRLate-demographic dividendLatin America & Caribbean Latin America & Caribbean (excluding high income)Latin America & the Caribbean (IDA & IBRD countries)LatviaLeast developed countries: UN classificationLebanonLesothoLiberiaLibyaLiechtensteinLithuaniaLow & middle incomeLow incomeLower middle incomeLuxembourgMacao SAR, ChinaMacedonia, FYRMadagascarMalawiMalaysiaMaldivesMaliMaltaMarshall IslandsMauritaniaMauritiusMexicoMicronesia, Fed. Sts.Middle East & North AfricaMiddle East & North Africa (excluding high income)Middle East & North Africa (IDA & IBRD countries)Middle incomeMoldovaMongoliaMontenegroMoroccoMozambiqueMyanmarNamibiaNepalNetherlandsNew CaledoniaNew ZealandNicaraguaNigerNigeriaNorth AmericaNorwayOECD membersOmanOther small statesPacific island small statesPakistanPalauPanamaPapua New GuineaParaguayPeruPhilippinesPolandPortugalPost-demographic dividendPre-demographic dividendPuerto RicoQatarRomaniaRussian FederationRwandaSamoaSan MarinoSao Tome and PrincipeSaudi ArabiaSenegalSerbiaSeychellesSierra LeoneSingaporeSint Maarten (Dutch part)Slovak RepublicSloveniaSmall statesSolomon IslandsSomaliaSouth AfricaSouth AsiaSouth Asia (IDA & IBRD)South SudanSpainSri LankaSt. Kitts and NevisSt. LuciaSt. Martin (French part)St. Vincent and the GrenadinesSub-Saharan Africa Sub-Saharan Africa (excluding high income)Sub-Saharan Africa (IDA & IBRD countries)SudanSurinameSwazilandSwedenSwitzerlandSyrian Arab RepublicTajikistanTanzaniaThailandTimor-LesteTogoTongaTrinidad and TobagoTunisiaTurkeyTurkmenistanUgandaUkraineUnited Arab EmiratesUnited KingdomUnited StatesUpper middle incomeUruguayUzbekistanVanuatuVenezuela, RBVietnamVirgin Islands (U.S.)West Bank and GazaWorldYemen, Rep.ZambiaZimbabwe Timeline:
This timeline shows a graph from 1961 to 2015 of East Asia & Pacific (IDA & IBRD countries). No data until 1960. Number of actual observations by date: 55.
Source name:
World Development Indicators
Source organization:
(1) United Nations Population Division. World Population Prospects, (2) Census reports and other statistical publications from national statistical offices, (3) Eurostat: Demographic Statistics, (4) United Nations Statistical Division. Population and Vital Statistics Reprot (various years), (5) U.S. Census Bureau: International Database, and (6) Secretariat of the Pacific Community: Statistics and Demography Programme.
Categories, topics:
Health, Gender, Social Development
Last updated:
apr 23, 2017
Indicators value changes by year
Minimum:
47.005
jan 1, 1961
Maximum:
75.994
jan 1, 2015
At the date of observation
Value
Absolute change
Change from previous value
jan 1, 1961
47.005
+47.005
0.0%
jan 1, 1962
47.443
+0.438
0.93%
jan 1, 1963
48.177
+0.734
1.55%
jan 1, 1964
49.247
+1.07
2.22%
jan 1, 1965
50.66
+1.413
2.87%
jan 1, 1966
52.327
+1.667
3.29%
jan 1, 1967
54.116
+1.789
3.42%
jan 1, 1968
55.874
+1.758
3.25%
jan 1, 1969
57.473
+1.599
2.86%
jan 1, 1970
58.851
+1.378
2.4%
jan 1, 1971
59.986
+1.134
1.93%
jan 1, 1972
60.901
+0.916
1.53%
jan 1, 1973
61.683
+0.782
1.28%
jan 1, 1974
62.403
+0.72
1.17%
jan 1, 1975
63.085
+0.682
1.09%
jan 1, 1976
63.748
+0.663
1.05%
jan 1, 1977
64.395
+0.647
1.02%
jan 1, 1978
65.016
+0.621
0.96%
jan 1, 1979
65.601
+0.585
0.9%
jan 1, 1980
66.148
+0.546
0.83%
jan 1, 1981
66.652
+0.505
0.76%
jan 1, 1982
67.11
+0.458
0.69%
jan 1, 1983
67.527
+0.416
0.62%
jan 1, 1984
67.902
+0.375
0.56%
jan 1, 1985
68.24
+0.339
0.5%
jan 1, 1986
68.547
+0.307
0.45%
jan 1, 1987
68.826
+0.279
0.41%
jan 1, 1988
69.085
+0.258
0.37%
jan 1, 1989
69.325
+0.241
0.35%
jan 1, 1990
69.556
+0.23
0.33%
jan 1, 1991
69.779
+0.223
0.32%
jan 1, 1992
70.002
+0.222
0.32%
jan 1, 1993
70.225
+0.223
0.32%
jan 1, 1994
70.452
+0.227
0.32%
jan 1, 1995
70.689
+0.237
0.34%
jan 1, 1996
70.941
+0.252
0.36%
jan 1, 1997
71.212
+0.271
0.38%
jan 1, 1998
71.502
+0.29
0.41%
jan 1, 1999
71.808
+0.306
0.43%
jan 1, 2000
72.127
+0.319
0.44%
jan 1, 2001
72.458
+0.331
0.46%
jan 1, 2002
72.797
+0.339
0.47%
jan 1, 2003
73.139
+0.341
0.47%
jan 1, 2004
73.477
+0.338
0.46%
jan 1, 2005
73.806
+0.329
0.45%
jan 1, 2006
74.117
+0.311
0.42%
jan 1, 2007
74.405
+0.287
0.39%
jan 1, 2008
74.664
+0.259
0.35%
jan 1, 2009
74.899
+0.234
0.31%
jan 1, 2010
75.107
+0.209
0.28%
jan 1, 2011
75.296
+0.189
0.25%
jan 1, 2012
75.472
+0.175
0.23%
jan 1, 2013
75.642
+0.171
0.23%
jan 1, 2014
75.815
+0.173
0.23%
jan 1, 2015
75.994
+0.179
0.24%
Ranking of countries by current statistics by years


Comments: