29
/
en
AIzaSyAYiBZKx7MnpbEhh9jyipgxe19OcubqV5w
April 1, 2024
204296
Myanmar
MMR
true
2
1
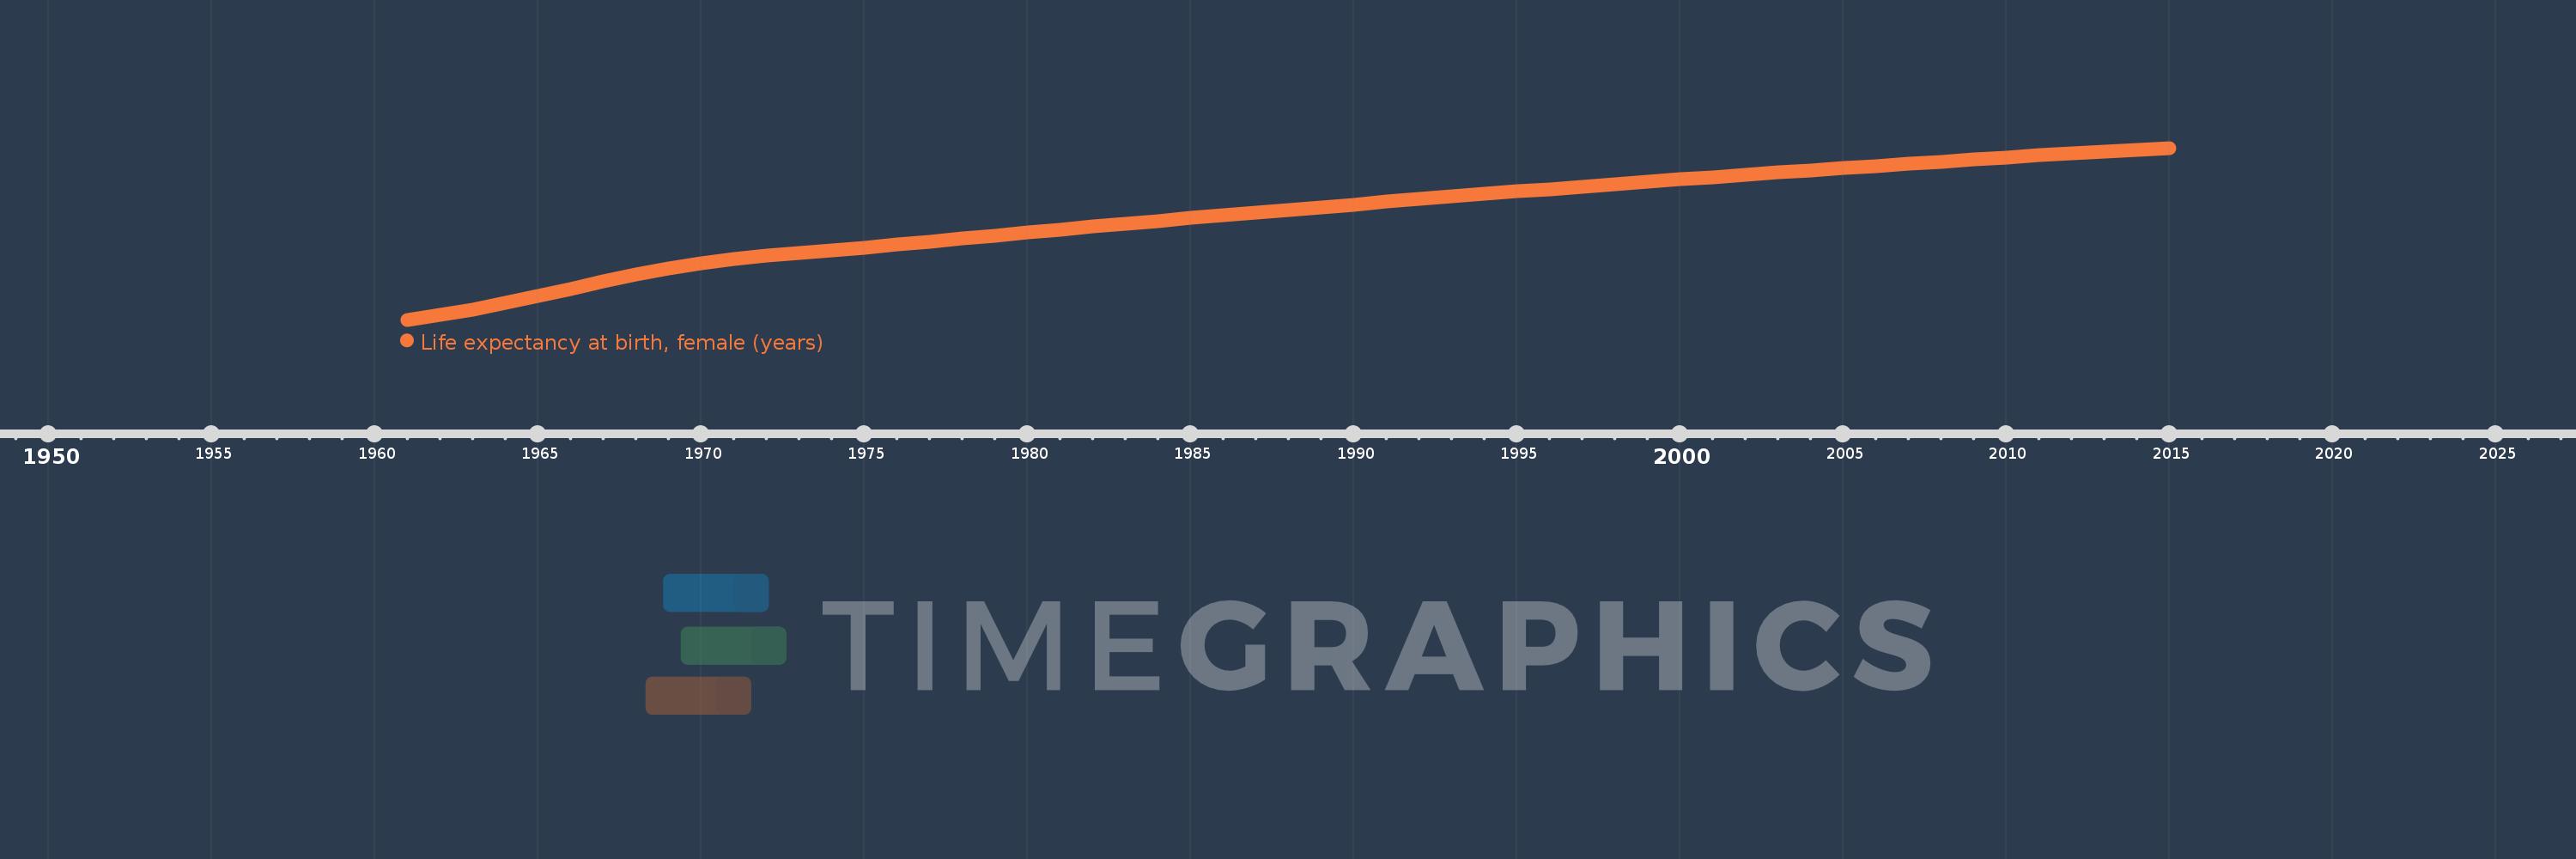
Life expectancy at birth, female (years)
2015,2014,2013,2012,2011,2010,2009,2008,2007,2006,2005,2004,2003,2002,2001,2000,1999,1998,1997,1996,1995,1994,1993,1992,1991,1990,1989,1988,1987,1986,1985,1984,1983,1982,1981,1980,1979,1978,1977,1976,1975,1974,1973,1972,1971,1970,1969,1968,1967,1966,1965,1964,1963,1962,1961
This statistics in other country:
AfghanistanAlbaniaAlgeriaAngolaAntigua and BarbudaArab WorldArgentinaArmeniaArubaAustraliaAustriaAzerbaijanBahamas, TheBahrainBangladeshBarbadosBelarusBelgiumBelizeBeninBermudaBhutanBoliviaBosnia and HerzegovinaBotswanaBrazilBrunei DarussalamBulgariaBurkina FasoBurundiCabo VerdeCambodiaCameroonCanadaCaribbean small statesCentral African RepublicCentral Europe and the BalticsChadChannel IslandsChileChinaColombiaComorosCongo, Dem. Rep.Congo, Rep.Costa RicaCote d'IvoireCroatiaCubaCuracaoCyprusCzech RepublicDenmarkDjiboutiDominicaDominican RepublicEarly-demographic dividendEast Asia & PacificEast Asia & Pacific (excluding high income)East Asia & Pacific (IDA & IBRD countries)EcuadorEgypt, Arab Rep.El SalvadorEquatorial GuineaEritreaEstoniaEthiopiaEuro areaEurope & Central AsiaEurope & Central Asia (excluding high income)Europe & Central Asia (IDA & IBRD countries)European UnionFaroe IslandsFijiFinlandFragile and conflict affected situationsFranceFrench PolynesiaGabonGambia, TheGeorgiaGermanyGhanaGreeceGreenlandGrenadaGuamGuatemalaGuineaGuinea-BissauGuyanaHaitiHeavily indebted poor countries (HIPC)High incomeHondurasHong Kong SAR, ChinaHungaryIBRD onlyIcelandIDA & IBRD totalIDA blendIDA onlyIDA totalIndiaIndonesiaIran, Islamic Rep.IraqIrelandIsle of ManIsraelItalyJamaicaJapanJordanKazakhstanKenyaKiribatiKorea, Dem. People’s Rep.Korea, Rep.KosovoKuwaitKyrgyz RepublicLao PDRLate-demographic dividendLatin America & Caribbean Latin America & Caribbean (excluding high income)Latin America & the Caribbean (IDA & IBRD countries)LatviaLeast developed countries: UN classificationLebanonLesothoLiberiaLibyaLiechtensteinLithuaniaLow & middle incomeLow incomeLower middle incomeLuxembourgMacao SAR, ChinaMacedonia, FYRMadagascarMalawiMalaysiaMaldivesMaliMaltaMarshall IslandsMauritaniaMauritiusMexicoMicronesia, Fed. Sts.Middle East & North AfricaMiddle East & North Africa (excluding high income)Middle East & North Africa (IDA & IBRD countries)Middle incomeMoldovaMongoliaMontenegroMoroccoMozambiqueMyanmarNamibiaNepalNetherlandsNew CaledoniaNew ZealandNicaraguaNigerNigeriaNorth AmericaNorwayOECD membersOmanOther small statesPacific island small statesPakistanPalauPanamaPapua New GuineaParaguayPeruPhilippinesPolandPortugalPost-demographic dividendPre-demographic dividendPuerto RicoQatarRomaniaRussian FederationRwandaSamoaSan MarinoSao Tome and PrincipeSaudi ArabiaSenegalSerbiaSeychellesSierra LeoneSingaporeSint Maarten (Dutch part)Slovak RepublicSloveniaSmall statesSolomon IslandsSomaliaSouth AfricaSouth AsiaSouth Asia (IDA & IBRD)South SudanSpainSri LankaSt. Kitts and NevisSt. LuciaSt. Martin (French part)St. Vincent and the GrenadinesSub-Saharan Africa Sub-Saharan Africa (excluding high income)Sub-Saharan Africa (IDA & IBRD countries)SudanSurinameSwazilandSwedenSwitzerlandSyrian Arab RepublicTajikistanTanzaniaThailandTimor-LesteTogoTongaTrinidad and TobagoTunisiaTurkeyTurkmenistanUgandaUkraineUnited Arab EmiratesUnited KingdomUnited StatesUpper middle incomeUruguayUzbekistanVanuatuVenezuela, RBVietnamVirgin Islands (U.S.)West Bank and GazaWorldYemen, Rep.ZambiaZimbabwe Timeline:
This timeline shows a graph from 1961 to 2015 of Myanmar. No data until 1960. Number of actual observations by date: 55.
Source name:
World Development Indicators
Source organization:
(1) United Nations Population Division. World Population Prospects, (2) Census reports and other statistical publications from national statistical offices, (3) Eurostat: Demographic Statistics, (4) United Nations Statistical Division. Population and Vital Statistics Reprot (various years), (5) U.S. Census Bureau: International Database, and (6) Secretariat of the Pacific Community: Statistics and Demography Programme.
Categories, topics:
Health, Gender, Social Development
Last updated:
apr 23, 2017
Indicators value changes by year
Minimum:
45.744
jan 1, 1961
Maximum:
67.964
jan 1, 2015
At the date of observation
Value
Absolute change
Change from previous value
jan 1, 1961
45.744
+45.744
0.0%
jan 1, 1962
46.383
+0.639
1.4%
jan 1, 1963
47.097
+0.714
1.54%
jan 1, 1964
47.906
+0.809
1.72%
jan 1, 1965
48.807
+0.901
1.88%
jan 1, 1966
49.764
+0.957
1.96%
jan 1, 1967
50.72
+0.956
1.92%
jan 1, 1968
51.61
+0.89
1.75%
jan 1, 1969
52.388
+0.778
1.51%
jan 1, 1970
53.038
+0.65
1.24%
jan 1, 1971
53.564
+0.526
0.99%
jan 1, 1972
53.99
+0.426
0.8%
jan 1, 1973
54.362
+0.372
0.69%
jan 1, 1974
54.719
+0.357
0.66%
jan 1, 1975
55.08
+0.361
0.66%
jan 1, 1976
55.456
+0.376
0.68%
jan 1, 1977
55.846
+0.39
0.7%
jan 1, 1978
56.24
+0.394
0.71%
jan 1, 1979
56.63
+0.39
0.69%
jan 1, 1980
57.016
+0.386
0.68%
jan 1, 1981
57.398
+0.382
0.67%
jan 1, 1982
57.775
+0.377
0.66%
jan 1, 1983
58.148
+0.373
0.65%
jan 1, 1984
58.516
+0.368
0.63%
jan 1, 1985
58.88
+0.364
0.62%
jan 1, 1986
59.24
+0.36
0.61%
jan 1, 1987
59.597
+0.357
0.6%
jan 1, 1988
59.951
+0.354
0.59%
jan 1, 1989
60.303
+0.352
0.59%
jan 1, 1990
60.652
+0.349
0.58%
jan 1, 1991
60.997
+0.345
0.57%
jan 1, 1992
61.338
+0.341
0.56%
jan 1, 1993
61.672
+0.334
0.54%
jan 1, 1994
62.0
+0.328
0.53%
jan 1, 1995
62.322
+0.322
0.52%
jan 1, 1996
62.64
+0.318
0.51%
jan 1, 1997
62.955
+0.315
0.5%
jan 1, 1998
63.268
+0.313
0.5%
jan 1, 1999
63.58
+0.312
0.49%
jan 1, 2000
63.892
+0.312
0.49%
jan 1, 2001
64.199
+0.307
0.48%
jan 1, 2002
64.501
+0.302
0.47%
jan 1, 2003
64.794
+0.293
0.45%
jan 1, 2004
65.078
+0.284
0.44%
jan 1, 2005
65.353
+0.275
0.42%
jan 1, 2006
65.623
+0.27
0.41%
jan 1, 2007
65.893
+0.27
0.41%
jan 1, 2008
66.165
+0.272
0.41%
jan 1, 2009
66.442
+0.277
0.42%
jan 1, 2010
66.72
+0.278
0.42%
jan 1, 2011
66.997
+0.277
0.42%
jan 1, 2012
67.264
+0.267
0.4%
jan 1, 2013
67.516
+0.252
0.37%
jan 1, 2014
67.75
+0.234
0.35%
jan 1, 2015
67.964
+0.214
0.32%
Ranking of countries by current statistics by years


Comments: