29
/
en
AIzaSyAYiBZKx7MnpbEhh9jyipgxe19OcubqV5w
April 1, 2024
62792
World
WLD
false
2
1
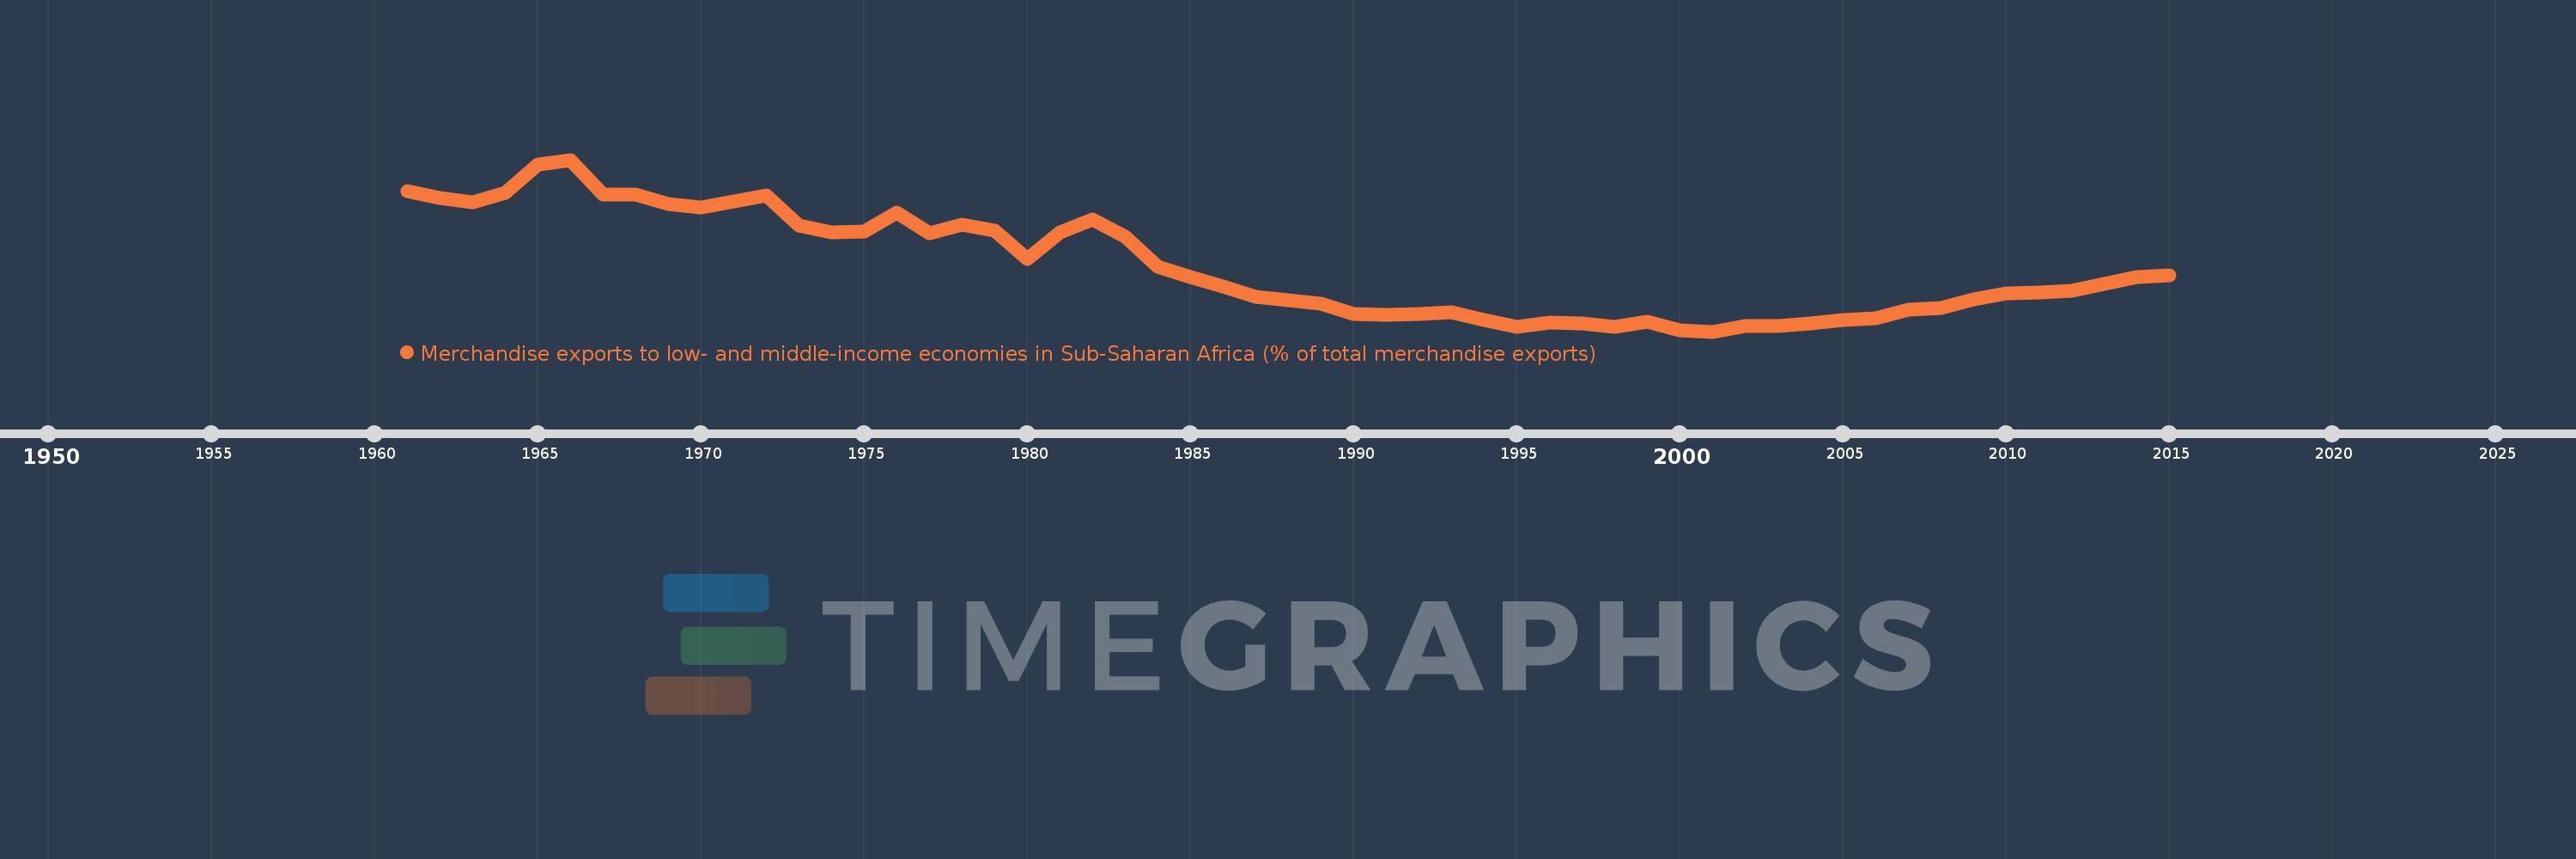
Merchandise exports to low- and middle-income economies in Sub-Saharan Africa (% of total merchandise exports)
2015,2014,2013,2012,2011,2010,2009,2008,2007,2006,2005,2004,2003,2002,2001,2000,1999,1998,1997,1996,1995,1994,1993,1992,1991,1990,1989,1988,1987,1986,1985,1984,1983,1982,1981,1980,1979,1978,1977,1976,1975,1974,1973,1972,1971,1970,1969,1968,1967,1966,1965,1964,1963,1962,1961
This statistics in other country:
AfghanistanAlbaniaAlgeriaAngolaArab WorldArgentinaArmeniaAustraliaAustriaAzerbaijanBahamas, TheBahrainBangladeshBarbadosBelarusBelgiumBelizeBeninBermudaBoliviaBrazilBulgariaBurkina FasoBurundiCabo VerdeCambodiaCameroonCanadaCaribbean small statesCentral African RepublicCentral Europe and the BalticsChadChileChinaColombiaCongo, Dem. Rep.Congo, Rep.Costa RicaCote d'IvoireCroatiaCubaCyprusCzech RepublicDenmarkDjiboutiDominicaDominican RepublicEarly-demographic dividendEast Asia & PacificEast Asia & Pacific (excluding high income)East Asia & Pacific (IDA & IBRD countries)EcuadorEgypt, Arab Rep.EstoniaEthiopiaEuro areaEurope & Central AsiaEurope & Central Asia (excluding high income)Europe & Central Asia (IDA & IBRD countries)European UnionFijiFinlandFragile and conflict affected situationsFranceGabonGambia, TheGeorgiaGermanyGhanaGibraltarGreeceGreenlandGuatemalaGuineaGuinea-BissauGuyanaHaitiHeavily indebted poor countries (HIPC)High incomeHondurasHong Kong SAR, ChinaHungaryIBRD onlyIcelandIDA & IBRD totalIDA blendIDA onlyIDA totalIndiaIndonesiaIran, Islamic Rep.IraqIrelandIsraelItalyJamaicaJapanJordanKazakhstanKenyaKorea, Dem. People’s Rep.Korea, Rep.KuwaitLao PDRLate-demographic dividendLatin America & Caribbean Latin America & Caribbean (excluding high income)Latin America & the Caribbean (IDA & IBRD countries)LatviaLeast developed countries: UN classificationLebanonLiberiaLibyaLithuaniaLow & middle incomeLow incomeLower middle incomeLuxembourgMacao SAR, ChinaMacedonia, FYRMadagascarMalawiMalaysiaMaliMaltaMauritaniaMauritiusMexicoMiddle East & North AfricaMiddle East & North Africa (excluding high income)Middle East & North Africa (IDA & IBRD countries)Middle incomeMoldovaMontenegroMoroccoMozambiqueMyanmarNetherlandsNew ZealandNicaraguaNigerNigeriaNorth AmericaNorwayOECD membersOmanOther small statesPacific island small statesPakistanPanamaPapua New GuineaParaguayPeruPhilippinesPolandPortugalPost-demographic dividendPre-demographic dividendQatarRomaniaRussian FederationRwandaSaudi ArabiaSenegalSerbiaSeychellesSierra LeoneSingaporeSlovak RepublicSloveniaSmall statesSomaliaSouth AfricaSouth AsiaSouth Asia (IDA & IBRD)SpainSri LankaSt. LuciaSt. Vincent and the GrenadinesSub-Saharan Africa Sub-Saharan Africa (excluding high income)Sub-Saharan Africa (IDA & IBRD countries)SudanSurinameSwedenSwitzerlandSyrian Arab RepublicTanzaniaThailandTogoTrinidad and TobagoTunisiaTurkeyUgandaUkraineUnited Arab EmiratesUnited KingdomUnited StatesUpper middle incomeUruguayVenezuela, RBVietnamWorldYemen, Rep.ZambiaZimbabwe Timeline:
This timeline shows a graph from 1961 to 2015 of World. No data until 1960. Number of actual observations by date: 55.
Source name:
World Development Indicators
Source organization:
World Bank staff estimates based data from International Monetary Fund's Direction of Trade database.
Categories, topics:
Private Sector, Trade
Last updated:
apr 23, 2017
Indicators value changes by year
At the date of observation
Value
Absolute change
Change from previous value
jan 1, 1961
3.616
+3.616
0.0%
jan 1, 1962
3.499
-0.117
-3.24%
jan 1, 1963
3.427
-0.071
-2.04%
jan 1, 1964
3.582
+0.155
4.51%
jan 1, 1965
4.072
+0.49
13.67%
jan 1, 1966
4.153
+0.081
1.99%
jan 1, 1967
3.561
-0.592
-14.25%
jan 1, 1968
3.551
-0.01
-0.27%
jan 1, 1969
3.386
-0.165
-4.66%
jan 1, 1970
3.335
-0.051
-1.52%
jan 1, 1971
3.44
+0.106
3.17%
jan 1, 1972
3.537
+0.097
2.82%
jan 1, 1973
3.019
-0.519
-14.66%
jan 1, 1974
2.91
-0.108
-3.59%
jan 1, 1975
2.925
+0.015
0.52%
jan 1, 1976
3.245
+0.32
10.92%
jan 1, 1977
2.885
-0.36
-11.09%
jan 1, 1978
3.038
+0.153
5.31%
jan 1, 1979
2.942
-0.097
-3.19%
jan 1, 1980
2.448
-0.494
-16.79%
jan 1, 1981
2.905
+0.458
18.7%
jan 1, 1982
3.121
+0.216
7.43%
jan 1, 1983
2.831
-0.29
-9.28%
jan 1, 1984
2.311
-0.52
-18.38%
jan 1, 1985
2.132
-0.179
-7.73%
jan 1, 1986
1.981
-0.151
-7.07%
jan 1, 1987
1.802
-0.179
-9.03%
jan 1, 1988
1.736
-0.067
-3.69%
jan 1, 1989
1.684
-0.052
-2.98%
jan 1, 1990
1.497
-0.187
-11.09%
jan 1, 1991
1.49
-0.008
-0.51%
jan 1, 1992
1.5
+0.01
0.69%
jan 1, 1993
1.528
+0.028
1.87%
jan 1, 1994
1.405
-0.123
-8.04%
jan 1, 1995
1.288
-0.117
-8.33%
jan 1, 1996
1.357
+0.069
5.36%
jan 1, 1997
1.335
-0.022
-1.65%
jan 1, 1998
1.288
-0.047
-3.52%
jan 1, 1999
1.368
+0.081
6.26%
jan 1, 2000
1.215
-0.154
-11.23%
jan 1, 2001
1.2
-0.014
-1.16%
jan 1, 2002
1.296
+0.096
7.98%
jan 1, 2003
1.296
0.0
-0.04%
jan 1, 2004
1.342
+0.046
3.58%
jan 1, 2005
1.405
+0.063
4.67%
jan 1, 2006
1.429
+0.024
1.71%
jan 1, 2007
1.574
+0.145
10.13%
jan 1, 2008
1.608
+0.034
2.18%
jan 1, 2009
1.755
+0.147
9.15%
jan 1, 2010
1.856
+0.101
5.75%
jan 1, 2011
1.869
+0.013
0.68%
jan 1, 2012
1.896
+0.027
1.46%
jan 1, 2013
2.022
+0.126
6.66%
jan 1, 2014
2.143
+0.121
5.97%
jan 1, 2015
2.165
+0.022
1.02%
Ranking of countries by current statistics by years


Comments: