29
/
en
AIzaSyAYiBZKx7MnpbEhh9jyipgxe19OcubqV5w
April 1, 2024
153788
Iceland
ISL
true
2
1
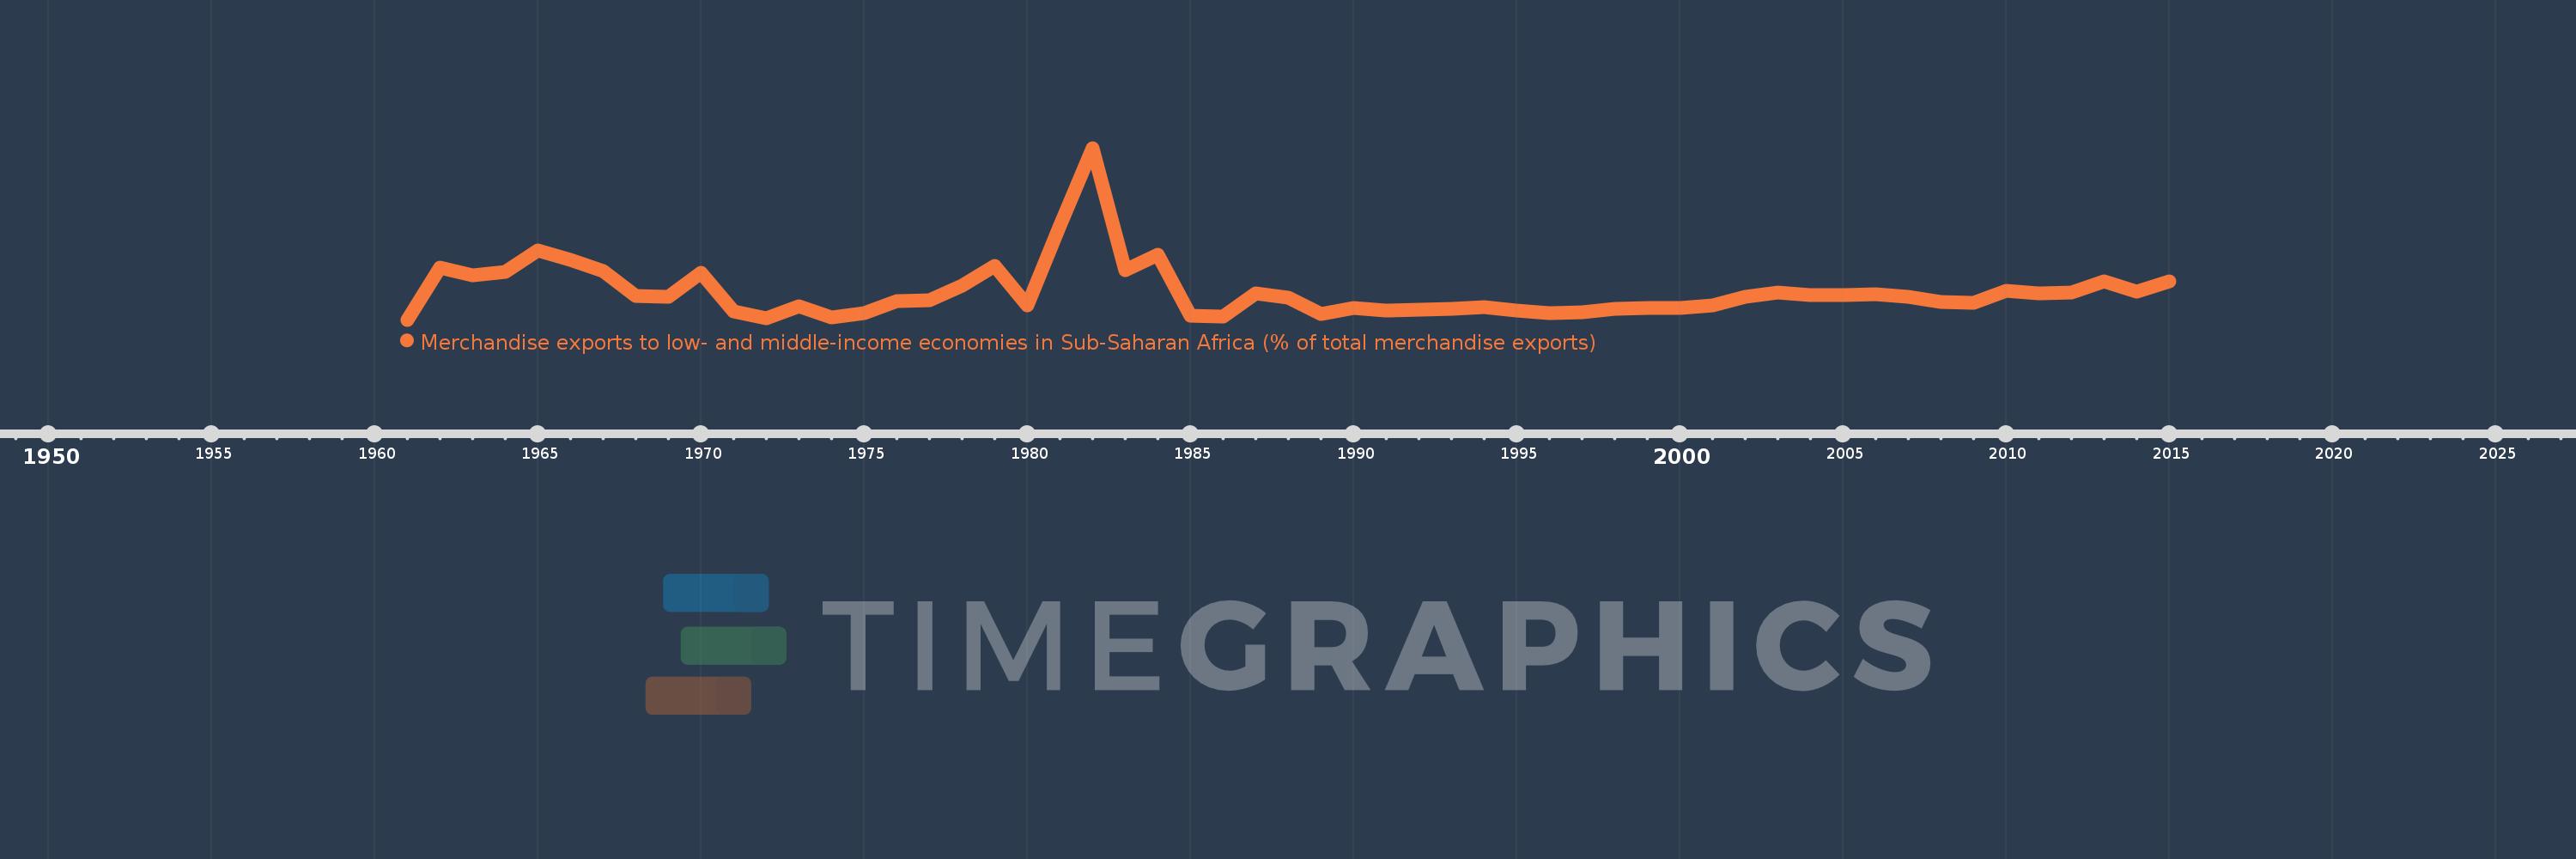
Merchandise exports to low- and middle-income economies in Sub-Saharan Africa (% of total merchandise exports)
2015,2014,2013,2012,2011,2010,2009,2008,2007,2006,2005,2004,2003,2002,2001,2000,1999,1998,1997,1996,1995,1994,1993,1992,1991,1990,1989,1988,1987,1986,1985,1984,1983,1982,1981,1980,1979,1978,1977,1976,1975,1974,1973,1972,1971,1970,1969,1968,1967,1966,1965,1964,1963,1962,1961
This statistics in other country:
AfghanistanAlbaniaAlgeriaAngolaArab WorldArgentinaArmeniaAustraliaAustriaAzerbaijanBahamas, TheBahrainBangladeshBarbadosBelarusBelgiumBelizeBeninBermudaBoliviaBrazilBulgariaBurkina FasoBurundiCabo VerdeCambodiaCameroonCanadaCaribbean small statesCentral African RepublicCentral Europe and the BalticsChadChileChinaColombiaCongo, Dem. Rep.Congo, Rep.Costa RicaCote d'IvoireCroatiaCubaCyprusCzech RepublicDenmarkDjiboutiDominicaDominican RepublicEarly-demographic dividendEast Asia & PacificEast Asia & Pacific (excluding high income)East Asia & Pacific (IDA & IBRD countries)EcuadorEgypt, Arab Rep.EstoniaEthiopiaEuro areaEurope & Central AsiaEurope & Central Asia (excluding high income)Europe & Central Asia (IDA & IBRD countries)European UnionFijiFinlandFragile and conflict affected situationsFranceGabonGambia, TheGeorgiaGermanyGhanaGibraltarGreeceGreenlandGuatemalaGuineaGuinea-BissauGuyanaHaitiHeavily indebted poor countries (HIPC)High incomeHondurasHong Kong SAR, ChinaHungaryIBRD onlyIcelandIDA & IBRD totalIDA blendIDA onlyIDA totalIndiaIndonesiaIran, Islamic Rep.IraqIrelandIsraelItalyJamaicaJapanJordanKazakhstanKenyaKorea, Dem. People’s Rep.Korea, Rep.KuwaitLao PDRLate-demographic dividendLatin America & Caribbean Latin America & Caribbean (excluding high income)Latin America & the Caribbean (IDA & IBRD countries)LatviaLeast developed countries: UN classificationLebanonLiberiaLibyaLithuaniaLow & middle incomeLow incomeLower middle incomeLuxembourgMacao SAR, ChinaMacedonia, FYRMadagascarMalawiMalaysiaMaliMaltaMauritaniaMauritiusMexicoMiddle East & North AfricaMiddle East & North Africa (excluding high income)Middle East & North Africa (IDA & IBRD countries)Middle incomeMoldovaMontenegroMoroccoMozambiqueMyanmarNetherlandsNew ZealandNicaraguaNigerNigeriaNorth AmericaNorwayOECD membersOmanOther small statesPacific island small statesPakistanPanamaPapua New GuineaParaguayPeruPhilippinesPolandPortugalPost-demographic dividendPre-demographic dividendQatarRomaniaRussian FederationRwandaSaudi ArabiaSenegalSerbiaSeychellesSierra LeoneSingaporeSlovak RepublicSloveniaSmall statesSomaliaSouth AfricaSouth AsiaSouth Asia (IDA & IBRD)SpainSri LankaSt. LuciaSt. Vincent and the GrenadinesSub-Saharan Africa Sub-Saharan Africa (excluding high income)Sub-Saharan Africa (IDA & IBRD countries)SudanSurinameSwedenSwitzerlandSyrian Arab RepublicTanzaniaThailandTogoTrinidad and TobagoTunisiaTurkeyUgandaUkraineUnited Arab EmiratesUnited KingdomUnited StatesUpper middle incomeUruguayVenezuela, RBVietnamWorldYemen, Rep.ZambiaZimbabwe Timeline:
This timeline shows a graph from 1961 to 2015 of Iceland. No data until 1960. Number of actual observations by date: 55.
Source name:
World Development Indicators
Source organization:
World Bank staff estimates based data from International Monetary Fund's Direction of Trade database.
Categories, topics:
Private Sector, Trade
Last updated:
apr 23, 2017
Indicators value changes by year
Maximum:
12.579
jan 1, 1982
At the date of observation
Value
Absolute change
Change from previous value
jan 1, 1962
3.824
+3.824
%
jan 1, 1963
3.222
-0.602
-15.75%
jan 1, 1964
3.522
+0.3
9.31%
jan 1, 1965
5.045
+1.523
43.25%
jan 1, 1966
4.415
-0.63
-12.48%
jan 1, 1967
3.566
-0.849
-19.23%
jan 1, 1968
1.767
-1.799
-50.45%
jan 1, 1969
1.709
-0.058
-3.27%
jan 1, 1970
3.426
+1.717
100.43%
jan 1, 1971
0.596
-2.83
-82.61%
jan 1, 1972
0.137
-0.459
-77.02%
jan 1, 1973
1.014
+0.877
640.5%
jan 1, 1974
0.146
-0.868
-85.63%
jan 1, 1975
0.484
+0.338
232.25%
jan 1, 1976
1.348
+0.864
178.44%
jan 1, 1977
1.397
+0.049
3.61%
jan 1, 1978
2.515
+1.118
80.06%
jan 1, 1979
3.939
+1.425
56.64%
jan 1, 1980
1.042
-2.898
-73.55%
jan 1, 1981
6.899
+5.858
562.26%
jan 1, 1982
12.579
+5.68
82.32%
jan 1, 1983
3.633
-8.946
-71.12%
jan 1, 1984
4.774
+1.141
31.39%
jan 1, 1985
0.269
-4.505
-94.37%
jan 1, 1986
0.251
-0.018
-6.63%
jan 1, 1987
1.936
+1.685
670.7%
jan 1, 1988
1.594
-0.342
-17.66%
jan 1, 1989
0.446
-1.148
-72.05%
jan 1, 1990
0.882
+0.437
97.97%
jan 1, 1991
0.682
-0.2
-22.68%
jan 1, 1992
0.74
+0.058
8.44%
jan 1, 1993
0.798
+0.059
7.91%
jan 1, 1994
0.902
+0.104
12.97%
jan 1, 1995
0.669
-0.232
-25.78%
jan 1, 1996
0.494
-0.175
-26.14%
jan 1, 1997
0.543
+0.049
9.87%
jan 1, 1998
0.791
+0.248
45.63%
jan 1, 1999
0.858
+0.068
8.54%
jan 1, 2000
0.832
-0.027
-3.12%
jan 1, 2001
1.071
+0.239
28.73%
jan 1, 2002
1.657
+0.587
54.78%
jan 1, 2003
1.963
+0.306
18.47%
jan 1, 2004
1.784
-0.179
-9.13%
jan 1, 2005
1.835
+0.051
2.84%
jan 1, 2006
1.892
+0.057
3.12%
jan 1, 2007
1.689
-0.203
-10.73%
jan 1, 2008
1.321
-0.368
-21.77%
jan 1, 2009
1.23
-0.092
-6.94%
jan 1, 2010
2.132
+0.902
73.38%
jan 1, 2011
1.931
-0.201
-9.43%
jan 1, 2012
2.009
+0.079
4.08%
jan 1, 2013
2.782
+0.772
38.44%
jan 1, 2014
2.078
-0.704
-25.3%
jan 1, 2015
2.793
+0.715
34.42%
Ranking of countries by current statistics by years


Comments: