29
/
en
AIzaSyAYiBZKx7MnpbEhh9jyipgxe19OcubqV5w
April 1, 2024
57284
South Asia
SAS
false
2
1
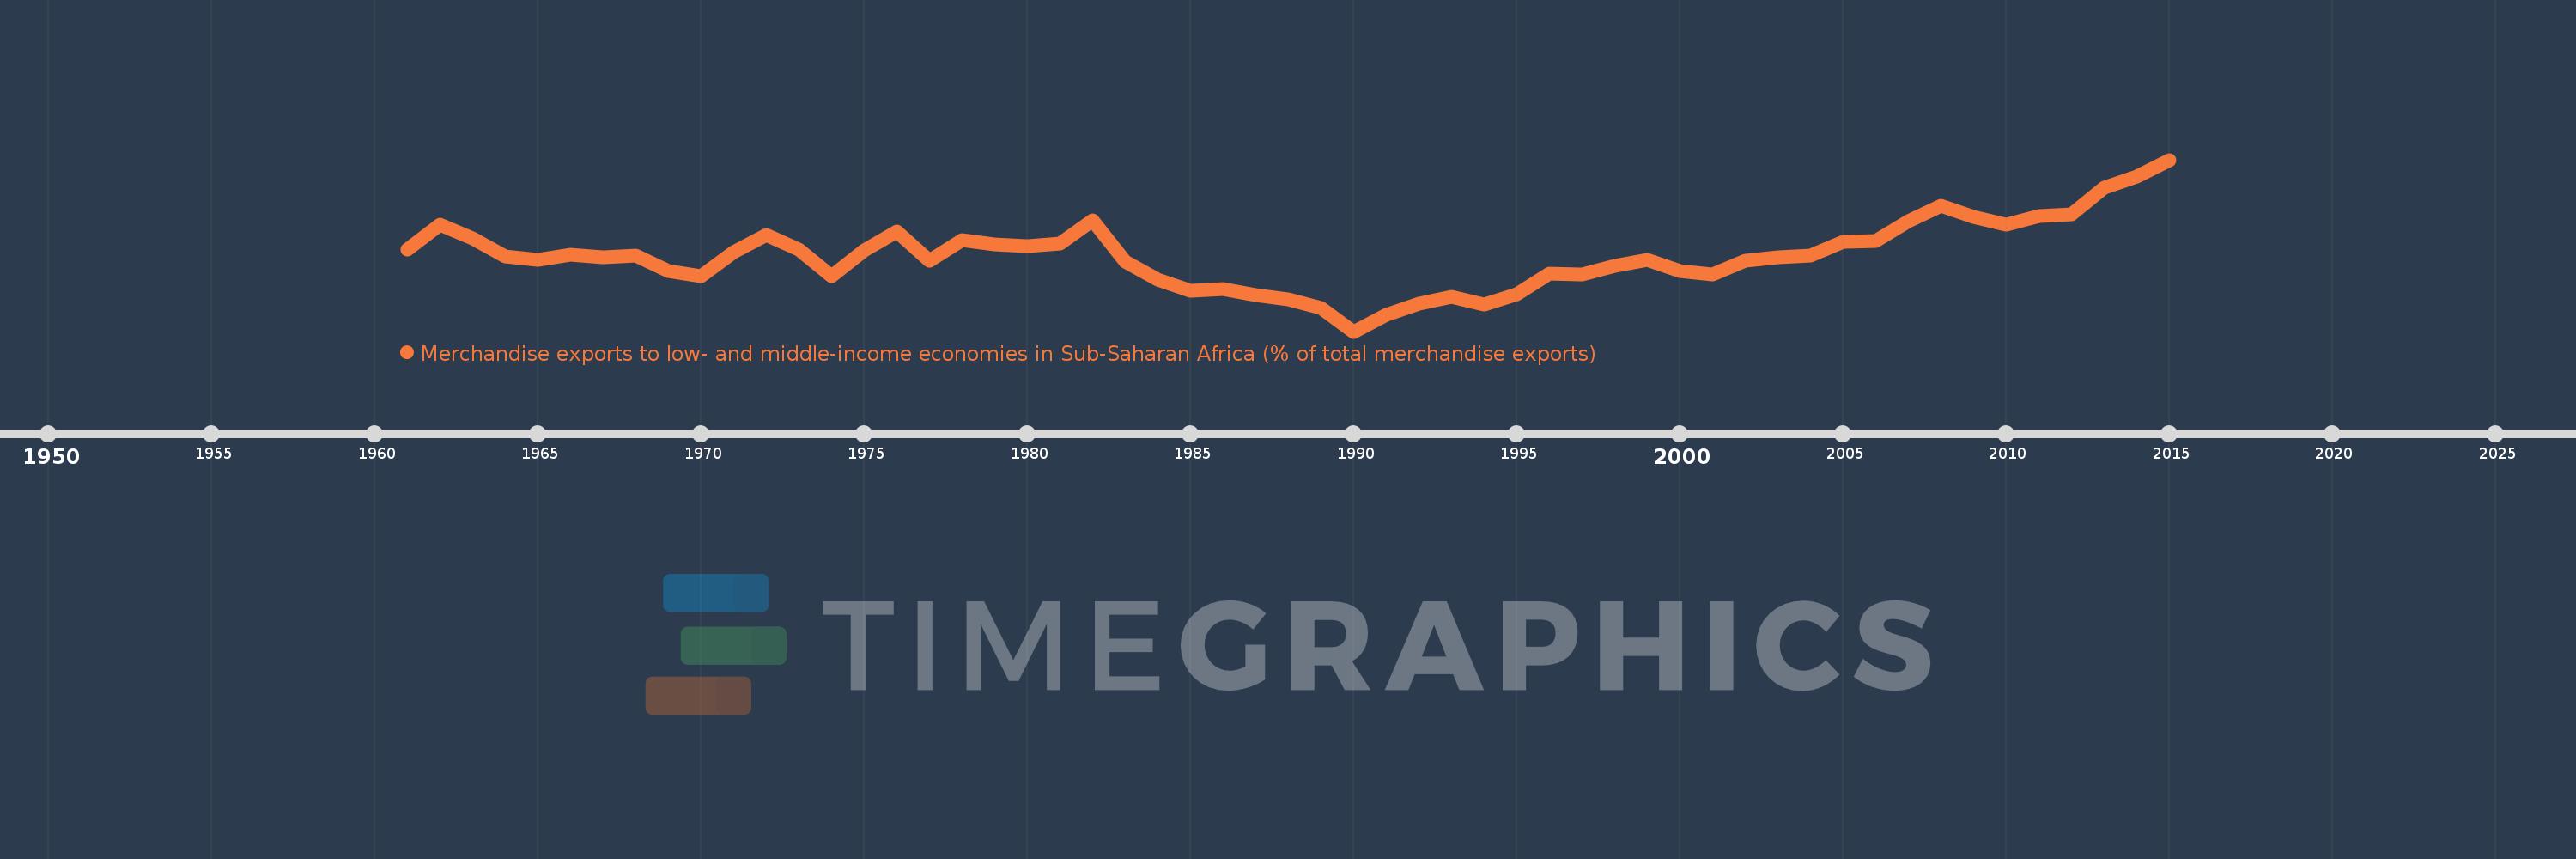
Merchandise exports to low- and middle-income economies in Sub-Saharan Africa (% of total merchandise exports)
2015,2014,2013,2012,2011,2010,2009,2008,2007,2006,2005,2004,2003,2002,2001,2000,1999,1998,1997,1996,1995,1994,1993,1992,1991,1990,1989,1988,1987,1986,1985,1984,1983,1982,1981,1980,1979,1978,1977,1976,1975,1974,1973,1972,1971,1970,1969,1968,1967,1966,1965,1964,1963,1962,1961
This statistics in other country:
AfghanistanAlbaniaAlgeriaAngolaArab WorldArgentinaArmeniaAustraliaAustriaAzerbaijanBahamas, TheBahrainBangladeshBarbadosBelarusBelgiumBelizeBeninBermudaBoliviaBrazilBulgariaBurkina FasoBurundiCabo VerdeCambodiaCameroonCanadaCaribbean small statesCentral African RepublicCentral Europe and the BalticsChadChileChinaColombiaCongo, Dem. Rep.Congo, Rep.Costa RicaCote d'IvoireCroatiaCubaCyprusCzech RepublicDenmarkDjiboutiDominicaDominican RepublicEarly-demographic dividendEast Asia & PacificEast Asia & Pacific (excluding high income)East Asia & Pacific (IDA & IBRD countries)EcuadorEgypt, Arab Rep.EstoniaEthiopiaEuro areaEurope & Central AsiaEurope & Central Asia (excluding high income)Europe & Central Asia (IDA & IBRD countries)European UnionFijiFinlandFragile and conflict affected situationsFranceGabonGambia, TheGeorgiaGermanyGhanaGibraltarGreeceGreenlandGuatemalaGuineaGuinea-BissauGuyanaHaitiHeavily indebted poor countries (HIPC)High incomeHondurasHong Kong SAR, ChinaHungaryIBRD onlyIcelandIDA & IBRD totalIDA blendIDA onlyIDA totalIndiaIndonesiaIran, Islamic Rep.IraqIrelandIsraelItalyJamaicaJapanJordanKazakhstanKenyaKorea, Dem. People’s Rep.Korea, Rep.KuwaitLao PDRLate-demographic dividendLatin America & Caribbean Latin America & Caribbean (excluding high income)Latin America & the Caribbean (IDA & IBRD countries)LatviaLeast developed countries: UN classificationLebanonLiberiaLibyaLithuaniaLow & middle incomeLow incomeLower middle incomeLuxembourgMacao SAR, ChinaMacedonia, FYRMadagascarMalawiMalaysiaMaliMaltaMauritaniaMauritiusMexicoMiddle East & North AfricaMiddle East & North Africa (excluding high income)Middle East & North Africa (IDA & IBRD countries)Middle incomeMoldovaMontenegroMoroccoMozambiqueMyanmarNetherlandsNew ZealandNicaraguaNigerNigeriaNorth AmericaNorwayOECD membersOmanOther small statesPacific island small statesPakistanPanamaPapua New GuineaParaguayPeruPhilippinesPolandPortugalPost-demographic dividendPre-demographic dividendQatarRomaniaRussian FederationRwandaSaudi ArabiaSenegalSerbiaSeychellesSierra LeoneSingaporeSlovak RepublicSloveniaSmall statesSomaliaSouth AfricaSouth AsiaSouth Asia (IDA & IBRD)SpainSri LankaSt. LuciaSt. Vincent and the GrenadinesSub-Saharan Africa Sub-Saharan Africa (excluding high income)Sub-Saharan Africa (IDA & IBRD countries)SudanSurinameSwedenSwitzerlandSyrian Arab RepublicTanzaniaThailandTogoTrinidad and TobagoTunisiaTurkeyUgandaUkraineUnited Arab EmiratesUnited KingdomUnited StatesUpper middle incomeUruguayVenezuela, RBVietnamWorldYemen, Rep.ZambiaZimbabwe Timeline:
This timeline shows a graph from 1961 to 2015 of South Asia. No data until 1960. Number of actual observations by date: 55.
Source name:
World Development Indicators
Source organization:
World Bank staff estimates based data from International Monetary Fund's Direction of Trade database.
Categories, topics:
Private Sector, Trade
Last updated:
apr 23, 2017
Indicators value changes by year
At the date of observation
Value
Absolute change
Change from previous value
jan 1, 1961
4.328
+4.328
0.0%
jan 1, 1962
5.315
+0.986
22.78%
jan 1, 1963
4.764
-0.55
-10.35%
jan 1, 1964
4.075
-0.69
-14.48%
jan 1, 1965
3.936
-0.138
-3.39%
jan 1, 1966
4.12
+0.184
4.67%
jan 1, 1967
4.036
-0.084
-2.03%
jan 1, 1968
4.095
+0.059
1.45%
jan 1, 1969
3.464
-0.631
-15.4%
jan 1, 1970
3.278
-0.186
-5.38%
jan 1, 1971
4.24
+0.962
29.35%
jan 1, 1972
4.914
+0.674
15.88%
jan 1, 1973
4.334
-0.579
-11.79%
jan 1, 1974
3.262
-1.072
-24.73%
jan 1, 1975
4.292
+1.03
31.57%
jan 1, 1976
5.043
+0.751
17.49%
jan 1, 1977
3.905
-1.138
-22.57%
jan 1, 1978
4.695
+0.79
20.22%
jan 1, 1979
4.528
-0.167
-3.55%
jan 1, 1980
4.468
-0.06
-1.33%
jan 1, 1981
4.555
+0.087
1.95%
jan 1, 1982
5.492
+0.937
20.56%
jan 1, 1983
3.846
-1.646
-29.98%
jan 1, 1984
3.14
-0.705
-18.34%
jan 1, 1985
2.7
-0.441
-14.04%
jan 1, 1986
2.783
+0.084
3.1%
jan 1, 1987
2.541
-0.243
-8.72%
jan 1, 1988
2.351
-0.189
-7.46%
jan 1, 1989
2.027
-0.324
-13.77%
jan 1, 1990
1.083
-0.945
-46.6%
jan 1, 1991
1.746
+0.663
61.23%
jan 1, 1992
2.198
+0.452
25.88%
jan 1, 1993
2.456
+0.259
11.77%
jan 1, 1994
2.161
-0.295
-12.0%
jan 1, 1995
2.563
+0.401
18.56%
jan 1, 1996
3.362
+0.799
31.19%
jan 1, 1997
3.352
-0.01
-0.3%
jan 1, 1998
3.69
+0.338
10.1%
jan 1, 1999
3.912
+0.222
6.03%
jan 1, 2000
3.467
-0.445
-11.37%
jan 1, 2001
3.348
-0.119
-3.43%
jan 1, 2002
3.879
+0.531
15.85%
jan 1, 2003
4.04
+0.161
4.15%
jan 1, 2004
4.087
+0.047
1.15%
jan 1, 2005
4.63
+0.543
13.3%
jan 1, 2006
4.66
+0.029
0.63%
jan 1, 2007
5.469
+0.81
17.37%
jan 1, 2008
6.052
+0.583
10.65%
jan 1, 2009
5.625
-0.427
-7.06%
jan 1, 2010
5.333
-0.291
-5.18%
jan 1, 2011
5.664
+0.331
6.21%
jan 1, 2012
5.729
+0.065
1.14%
jan 1, 2013
6.794
+1.065
18.59%
jan 1, 2014
7.213
+0.419
6.17%
jan 1, 2015
7.884
+0.671
9.31%
Ranking of countries by current statistics by years


Comments: