29
/
en
AIzaSyAYiBZKx7MnpbEhh9jyipgxe19OcubqV5w
April 1, 2024
30063
Euro area
EMU
false
2
1
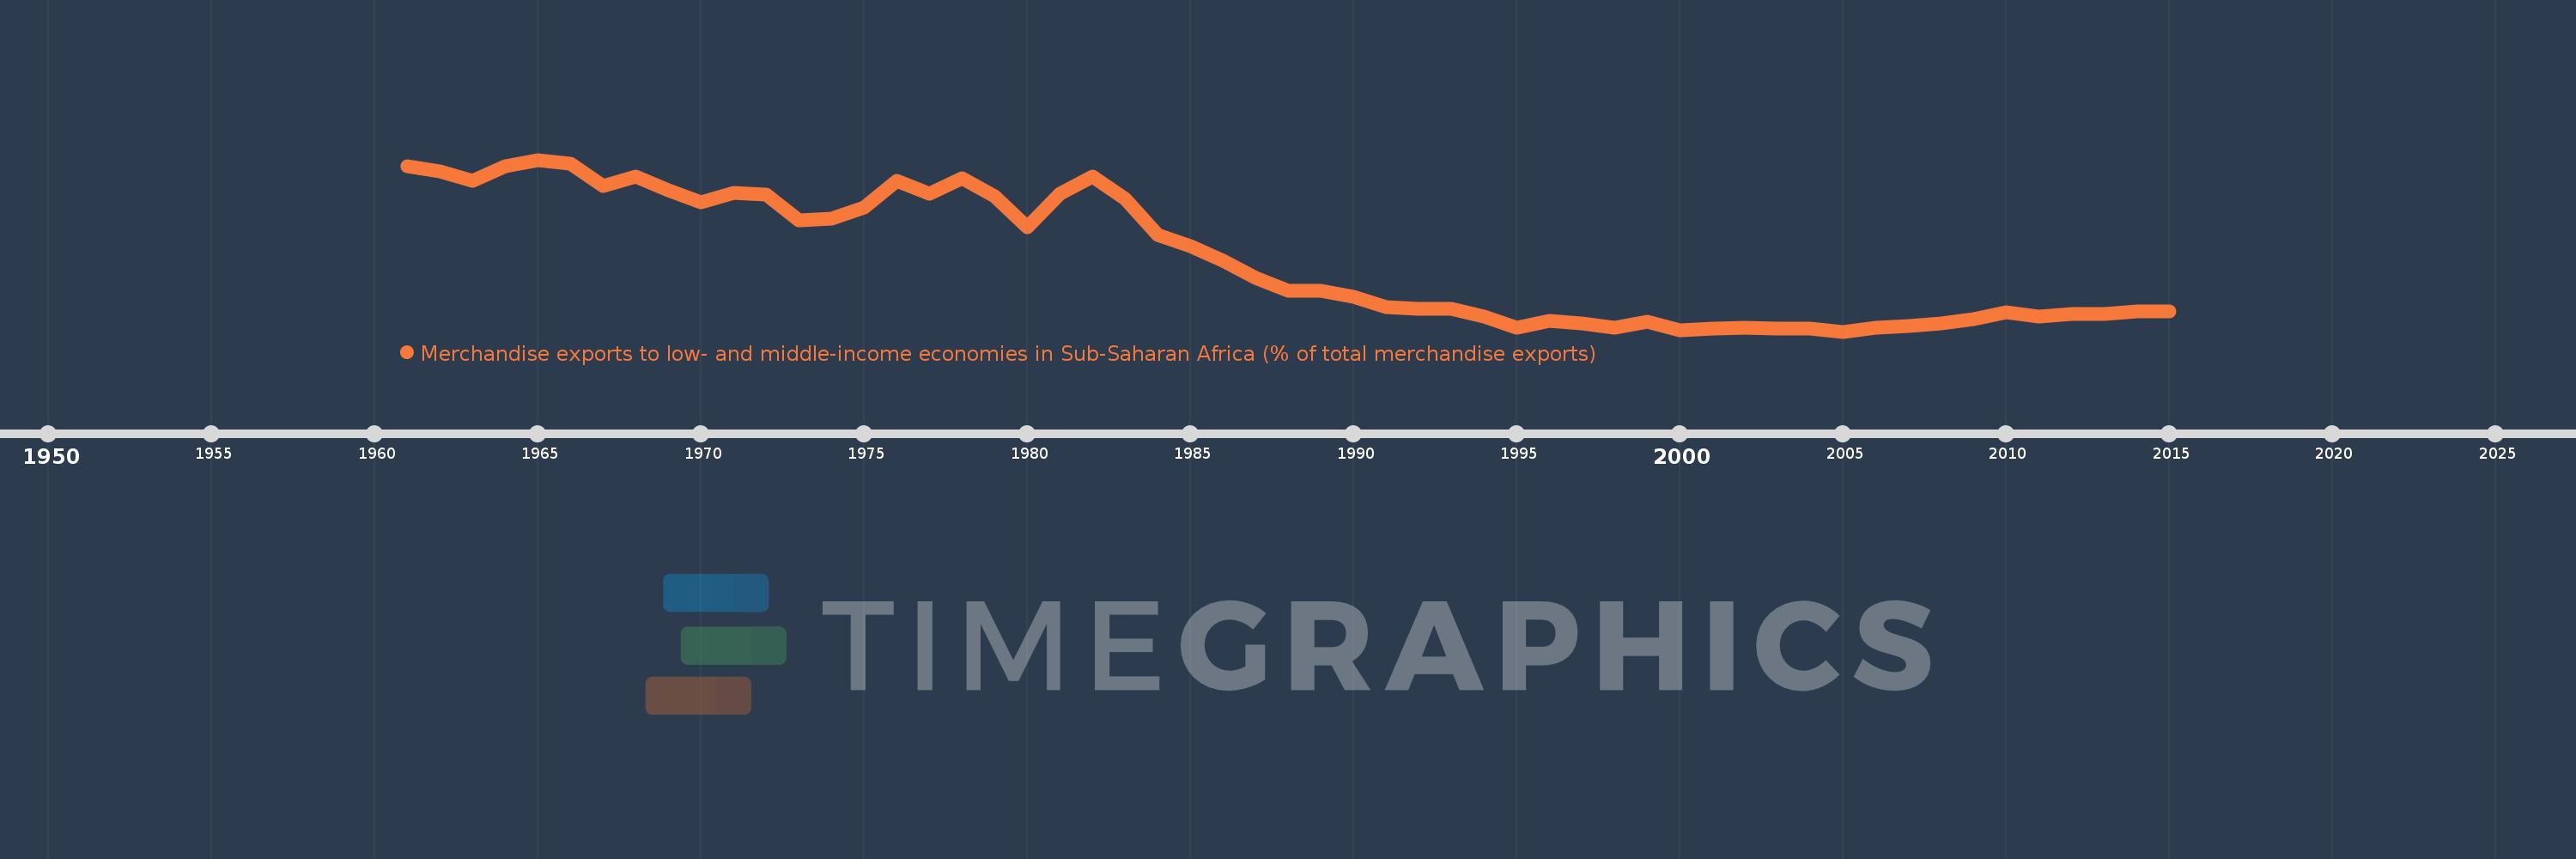
Merchandise exports to low- and middle-income economies in Sub-Saharan Africa (% of total merchandise exports)
2015,2014,2013,2012,2011,2010,2009,2008,2007,2006,2005,2004,2003,2002,2001,2000,1999,1998,1997,1996,1995,1994,1993,1992,1991,1990,1989,1988,1987,1986,1985,1984,1983,1982,1981,1980,1979,1978,1977,1976,1975,1974,1973,1972,1971,1970,1969,1968,1967,1966,1965,1964,1963,1962,1961
This statistics in other country:
AfghanistanAlbaniaAlgeriaAngolaArab WorldArgentinaArmeniaAustraliaAustriaAzerbaijanBahamas, TheBahrainBangladeshBarbadosBelarusBelgiumBelizeBeninBermudaBoliviaBrazilBulgariaBurkina FasoBurundiCabo VerdeCambodiaCameroonCanadaCaribbean small statesCentral African RepublicCentral Europe and the BalticsChadChileChinaColombiaCongo, Dem. Rep.Congo, Rep.Costa RicaCote d'IvoireCroatiaCubaCyprusCzech RepublicDenmarkDjiboutiDominicaDominican RepublicEarly-demographic dividendEast Asia & PacificEast Asia & Pacific (excluding high income)East Asia & Pacific (IDA & IBRD countries)EcuadorEgypt, Arab Rep.EstoniaEthiopiaEuro areaEurope & Central AsiaEurope & Central Asia (excluding high income)Europe & Central Asia (IDA & IBRD countries)European UnionFijiFinlandFragile and conflict affected situationsFranceGabonGambia, TheGeorgiaGermanyGhanaGibraltarGreeceGreenlandGuatemalaGuineaGuinea-BissauGuyanaHaitiHeavily indebted poor countries (HIPC)High incomeHondurasHong Kong SAR, ChinaHungaryIBRD onlyIcelandIDA & IBRD totalIDA blendIDA onlyIDA totalIndiaIndonesiaIran, Islamic Rep.IraqIrelandIsraelItalyJamaicaJapanJordanKazakhstanKenyaKorea, Dem. People’s Rep.Korea, Rep.KuwaitLao PDRLate-demographic dividendLatin America & Caribbean Latin America & Caribbean (excluding high income)Latin America & the Caribbean (IDA & IBRD countries)LatviaLeast developed countries: UN classificationLebanonLiberiaLibyaLithuaniaLow & middle incomeLow incomeLower middle incomeLuxembourgMacao SAR, ChinaMacedonia, FYRMadagascarMalawiMalaysiaMaliMaltaMauritaniaMauritiusMexicoMiddle East & North AfricaMiddle East & North Africa (excluding high income)Middle East & North Africa (IDA & IBRD countries)Middle incomeMoldovaMontenegroMoroccoMozambiqueMyanmarNetherlandsNew ZealandNicaraguaNigerNigeriaNorth AmericaNorwayOECD membersOmanOther small statesPacific island small statesPakistanPanamaPapua New GuineaParaguayPeruPhilippinesPolandPortugalPost-demographic dividendPre-demographic dividendQatarRomaniaRussian FederationRwandaSaudi ArabiaSenegalSerbiaSeychellesSierra LeoneSingaporeSlovak RepublicSloveniaSmall statesSomaliaSouth AfricaSouth AsiaSouth Asia (IDA & IBRD)SpainSri LankaSt. LuciaSt. Vincent and the GrenadinesSub-Saharan Africa Sub-Saharan Africa (excluding high income)Sub-Saharan Africa (IDA & IBRD countries)SudanSurinameSwedenSwitzerlandSyrian Arab RepublicTanzaniaThailandTogoTrinidad and TobagoTunisiaTurkeyUgandaUkraineUnited Arab EmiratesUnited KingdomUnited StatesUpper middle incomeUruguayVenezuela, RBVietnamWorldYemen, Rep.ZambiaZimbabwe Timeline:
This timeline shows a graph from 1961 to 2015 of Euro area. No data until 1960. Number of actual observations by date: 55.
Source name:
World Development Indicators
Source organization:
World Bank staff estimates based data from International Monetary Fund's Direction of Trade database.
Categories, topics:
Private Sector, Trade
Last updated:
apr 23, 2017
Indicators value changes by year
At the date of observation
Value
Absolute change
Change from previous value
jan 1, 1961
4.302
+4.302
0.0%
jan 1, 1962
4.207
-0.095
-2.22%
jan 1, 1963
4.046
-0.161
-3.83%
jan 1, 1964
4.315
+0.269
6.65%
jan 1, 1965
4.428
+0.113
2.62%
jan 1, 1966
4.356
-0.072
-1.63%
jan 1, 1967
3.942
-0.413
-9.49%
jan 1, 1968
4.111
+0.169
4.29%
jan 1, 1969
3.871
-0.24
-5.83%
jan 1, 1970
3.643
-0.228
-5.89%
jan 1, 1971
3.823
+0.18
4.93%
jan 1, 1972
3.78
-0.043
-1.13%
jan 1, 1973
3.308
-0.472
-12.48%
jan 1, 1974
3.341
+0.033
0.99%
jan 1, 1975
3.54
+0.199
5.97%
jan 1, 1976
4.036
+0.496
14.01%
jan 1, 1977
3.809
-0.227
-5.62%
jan 1, 1978
4.085
+0.276
7.24%
jan 1, 1979
3.755
-0.33
-8.07%
jan 1, 1980
3.182
-0.574
-15.27%
jan 1, 1981
3.797
+0.615
19.34%
jan 1, 1982
4.12
+0.323
8.5%
jan 1, 1983
3.705
-0.415
-10.08%
jan 1, 1984
3.045
-0.659
-17.8%
jan 1, 1985
2.835
-0.21
-6.9%
jan 1, 1986
2.572
-0.263
-9.29%
jan 1, 1987
2.254
-0.318
-12.36%
jan 1, 1988
2.016
-0.238
-10.55%
jan 1, 1989
2.011
-0.005
-0.27%
jan 1, 1990
1.904
-0.107
-5.31%
jan 1, 1991
1.712
-0.192
-10.08%
jan 1, 1992
1.673
-0.038
-2.24%
jan 1, 1993
1.673
-0.001
-0.05%
jan 1, 1994
1.528
-0.145
-8.65%
jan 1, 1995
1.332
-0.196
-12.83%
jan 1, 1996
1.45
+0.118
8.82%
jan 1, 1997
1.404
-0.045
-3.13%
jan 1, 1998
1.329
-0.075
-5.36%
jan 1, 1999
1.439
+0.11
8.25%
jan 1, 2000
1.283
-0.156
-10.83%
jan 1, 2001
1.305
+0.023
1.76%
jan 1, 2002
1.333
+0.028
2.13%
jan 1, 2003
1.305
-0.028
-2.11%
jan 1, 2004
1.304
-0.001
-0.07%
jan 1, 2005
1.256
-0.048
-3.72%
jan 1, 2006
1.32
+0.064
5.1%
jan 1, 2007
1.358
+0.038
2.88%
jan 1, 2008
1.404
+0.046
3.41%
jan 1, 2009
1.485
+0.081
5.78%
jan 1, 2010
1.615
+0.13
8.76%
jan 1, 2011
1.528
-0.087
-5.38%
jan 1, 2012
1.579
+0.051
3.32%
jan 1, 2013
1.584
+0.005
0.32%
jan 1, 2014
1.63
+0.045
2.87%
jan 1, 2015
1.624
-0.006
-0.36%
Ranking of countries by current statistics by years


Comments: