29
/
en
AIzaSyAYiBZKx7MnpbEhh9jyipgxe19OcubqV5w
April 1, 2024
193282
Mauritania
MRT
true
2
1
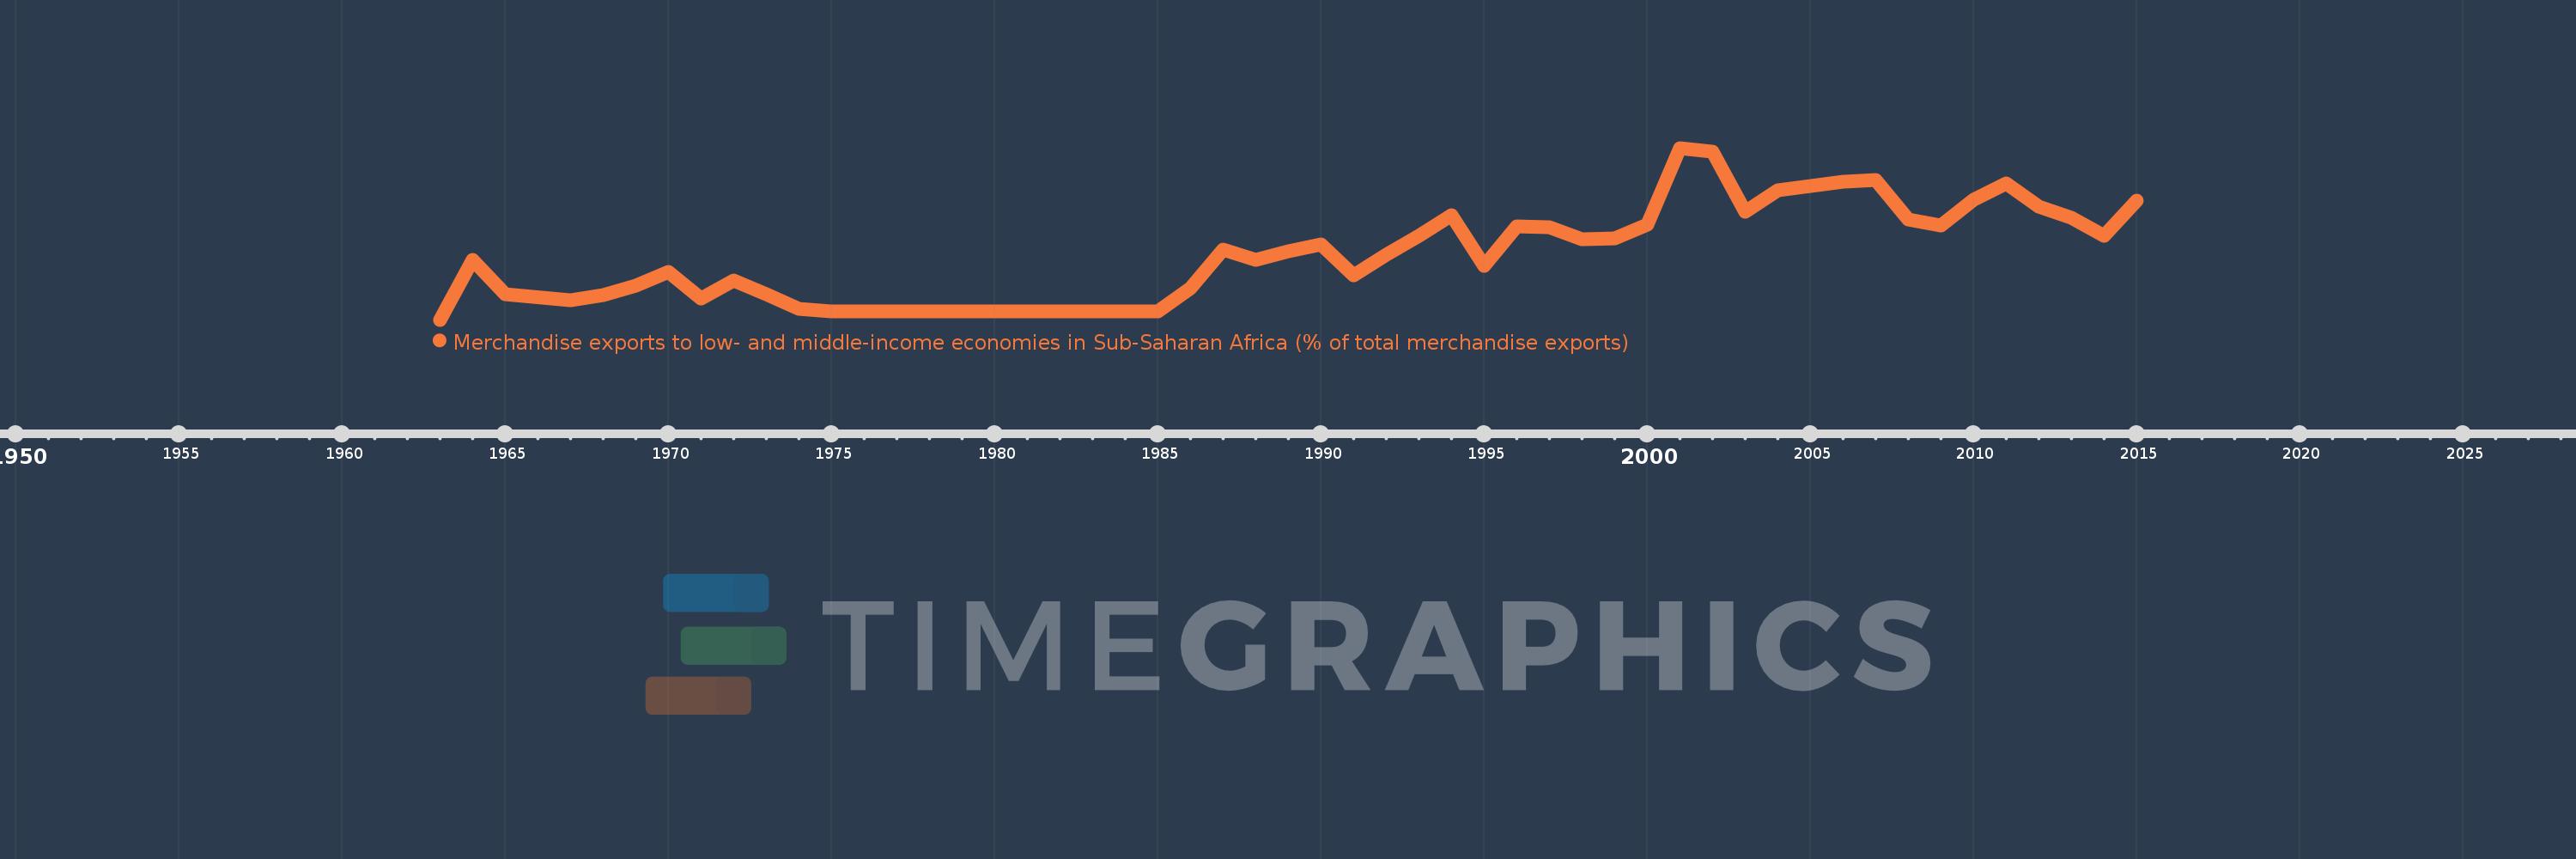
Merchandise exports to low- and middle-income economies in Sub-Saharan Africa (% of total merchandise exports)
2015,2014,2013,2012,2011,2010,2009,2008,2007,2006,2005,2004,2003,2002,2001,2000,1999,1998,1997,1996,1995,1994,1993,1992,1991,1990,1989,1988,1987,1986,1985,1984,1983,1982,1975,1974,1973,1972,1971,1970,1969,1968,1967,1965,1964,1963
This statistics in other country:
AfghanistanAlbaniaAlgeriaAngolaArab WorldArgentinaArmeniaAustraliaAustriaAzerbaijanBahamas, TheBahrainBangladeshBarbadosBelarusBelgiumBelizeBeninBermudaBoliviaBrazilBulgariaBurkina FasoBurundiCabo VerdeCambodiaCameroonCanadaCaribbean small statesCentral African RepublicCentral Europe and the BalticsChadChileChinaColombiaCongo, Dem. Rep.Congo, Rep.Costa RicaCote d'IvoireCroatiaCubaCyprusCzech RepublicDenmarkDjiboutiDominicaDominican RepublicEarly-demographic dividendEast Asia & PacificEast Asia & Pacific (excluding high income)East Asia & Pacific (IDA & IBRD countries)EcuadorEgypt, Arab Rep.EstoniaEthiopiaEuro areaEurope & Central AsiaEurope & Central Asia (excluding high income)Europe & Central Asia (IDA & IBRD countries)European UnionFijiFinlandFragile and conflict affected situationsFranceGabonGambia, TheGeorgiaGermanyGhanaGibraltarGreeceGreenlandGuatemalaGuineaGuinea-BissauGuyanaHaitiHeavily indebted poor countries (HIPC)High incomeHondurasHong Kong SAR, ChinaHungaryIBRD onlyIcelandIDA & IBRD totalIDA blendIDA onlyIDA totalIndiaIndonesiaIran, Islamic Rep.IraqIrelandIsraelItalyJamaicaJapanJordanKazakhstanKenyaKorea, Dem. People’s Rep.Korea, Rep.KuwaitLao PDRLate-demographic dividendLatin America & Caribbean Latin America & Caribbean (excluding high income)Latin America & the Caribbean (IDA & IBRD countries)LatviaLeast developed countries: UN classificationLebanonLiberiaLibyaLithuaniaLow & middle incomeLow incomeLower middle incomeLuxembourgMacao SAR, ChinaMacedonia, FYRMadagascarMalawiMalaysiaMaliMaltaMauritaniaMauritiusMexicoMiddle East & North AfricaMiddle East & North Africa (excluding high income)Middle East & North Africa (IDA & IBRD countries)Middle incomeMoldovaMontenegroMoroccoMozambiqueMyanmarNetherlandsNew ZealandNicaraguaNigerNigeriaNorth AmericaNorwayOECD membersOmanOther small statesPacific island small statesPakistanPanamaPapua New GuineaParaguayPeruPhilippinesPolandPortugalPost-demographic dividendPre-demographic dividendQatarRomaniaRussian FederationRwandaSaudi ArabiaSenegalSerbiaSeychellesSierra LeoneSingaporeSlovak RepublicSloveniaSmall statesSomaliaSouth AfricaSouth AsiaSouth Asia (IDA & IBRD)SpainSri LankaSt. LuciaSt. Vincent and the GrenadinesSub-Saharan Africa Sub-Saharan Africa (excluding high income)Sub-Saharan Africa (IDA & IBRD countries)SudanSurinameSwedenSwitzerlandSyrian Arab RepublicTanzaniaThailandTogoTrinidad and TobagoTunisiaTurkeyUgandaUkraineUnited Arab EmiratesUnited KingdomUnited StatesUpper middle incomeUruguayVenezuela, RBVietnamWorldYemen, Rep.ZambiaZimbabwe Timeline:
This timeline shows a graph from 1963 to 2015 of Mauritania. No data until 1962. Number of actual observations by date: 46.
Source name:
World Development Indicators
Source organization:
World Bank staff estimates based data from International Monetary Fund's Direction of Trade database.
Categories, topics:
Private Sector, Trade
Last updated:
apr 23, 2017
Indicators value changes by year
Maximum:
20.396
jan 1, 2001
At the date of observation
Value
Absolute change
Change from previous value
jan 1, 1964
7.143
+7.143
%
jan 1, 1965
3.05
-4.093
-57.3%
jan 1, 1967
2.315
-0.735
-24.09%
jan 1, 1968
2.924
+0.609
26.3%
jan 1, 1969
4.098
+1.174
40.15%
jan 1, 1970
5.721
+1.623
39.59%
jan 1, 1971
2.488
-3.234
-56.52%
jan 1, 1972
4.614
+2.127
85.49%
jan 1, 1973
2.994
-1.621
-35.12%
jan 1, 1974
1.333
-1.661
-55.47%
jan 1, 1975
0.954
-0.38
-28.47%
jan 1, 1982
0.954
+0.0
0.0%
jan 1, 1983
0.954
+0.0
0.0%
jan 1, 1984
0.954
0.0
0.0%
jan 1, 1985
0.954
+0.0
0.0%
jan 1, 1986
3.692
+2.739
287.2%
jan 1, 1987
8.335
+4.642
125.73%
jan 1, 1988
7.109
-1.226
-14.71%
jan 1, 1989
8.16
+1.051
14.79%
jan 1, 1990
8.907
+0.746
9.14%
jan 1, 1991
5.276
-3.631
-40.76%
jan 1, 1992
7.697
+2.421
45.88%
jan 1, 1993
9.954
+2.258
29.33%
jan 1, 1994
12.393
+2.438
24.5%
jan 1, 1995
6.416
-5.977
-48.23%
jan 1, 1996
11.05
+4.633
72.22%
jan 1, 1997
10.933
-0.117
-1.06%
jan 1, 1998
9.561
-1.372
-12.55%
jan 1, 1999
9.617
+0.056
0.59%
jan 1, 2000
11.277
+1.66
17.26%
jan 1, 2001
20.396
+9.119
80.86%
jan 1, 2002
19.942
-0.455
-2.23%
jan 1, 2003
12.788
-7.154
-35.88%
jan 1, 2004
15.369
+2.582
20.19%
jan 1, 2005
15.871
+0.501
3.26%
jan 1, 2006
16.429
+0.559
3.52%
jan 1, 2007
16.607
+0.177
1.08%
jan 1, 2008
11.938
-4.669
-28.11%
jan 1, 2009
11.192
-0.746
-6.25%
jan 1, 2010
14.267
+3.075
27.48%
jan 1, 2011
16.145
+1.879
13.17%
jan 1, 2012
13.453
-2.693
-16.68%
jan 1, 2013
12.059
-1.394
-10.36%
jan 1, 2014
9.923
-2.136
-17.71%
jan 1, 2015
14.182
+4.259
42.92%
Ranking of countries by current statistics by years


Comments: