29
/
en
AIzaSyAYiBZKx7MnpbEhh9jyipgxe19OcubqV5w
April 1, 2024
59114
Sub-Saharan Africa
SSF
false
2
1
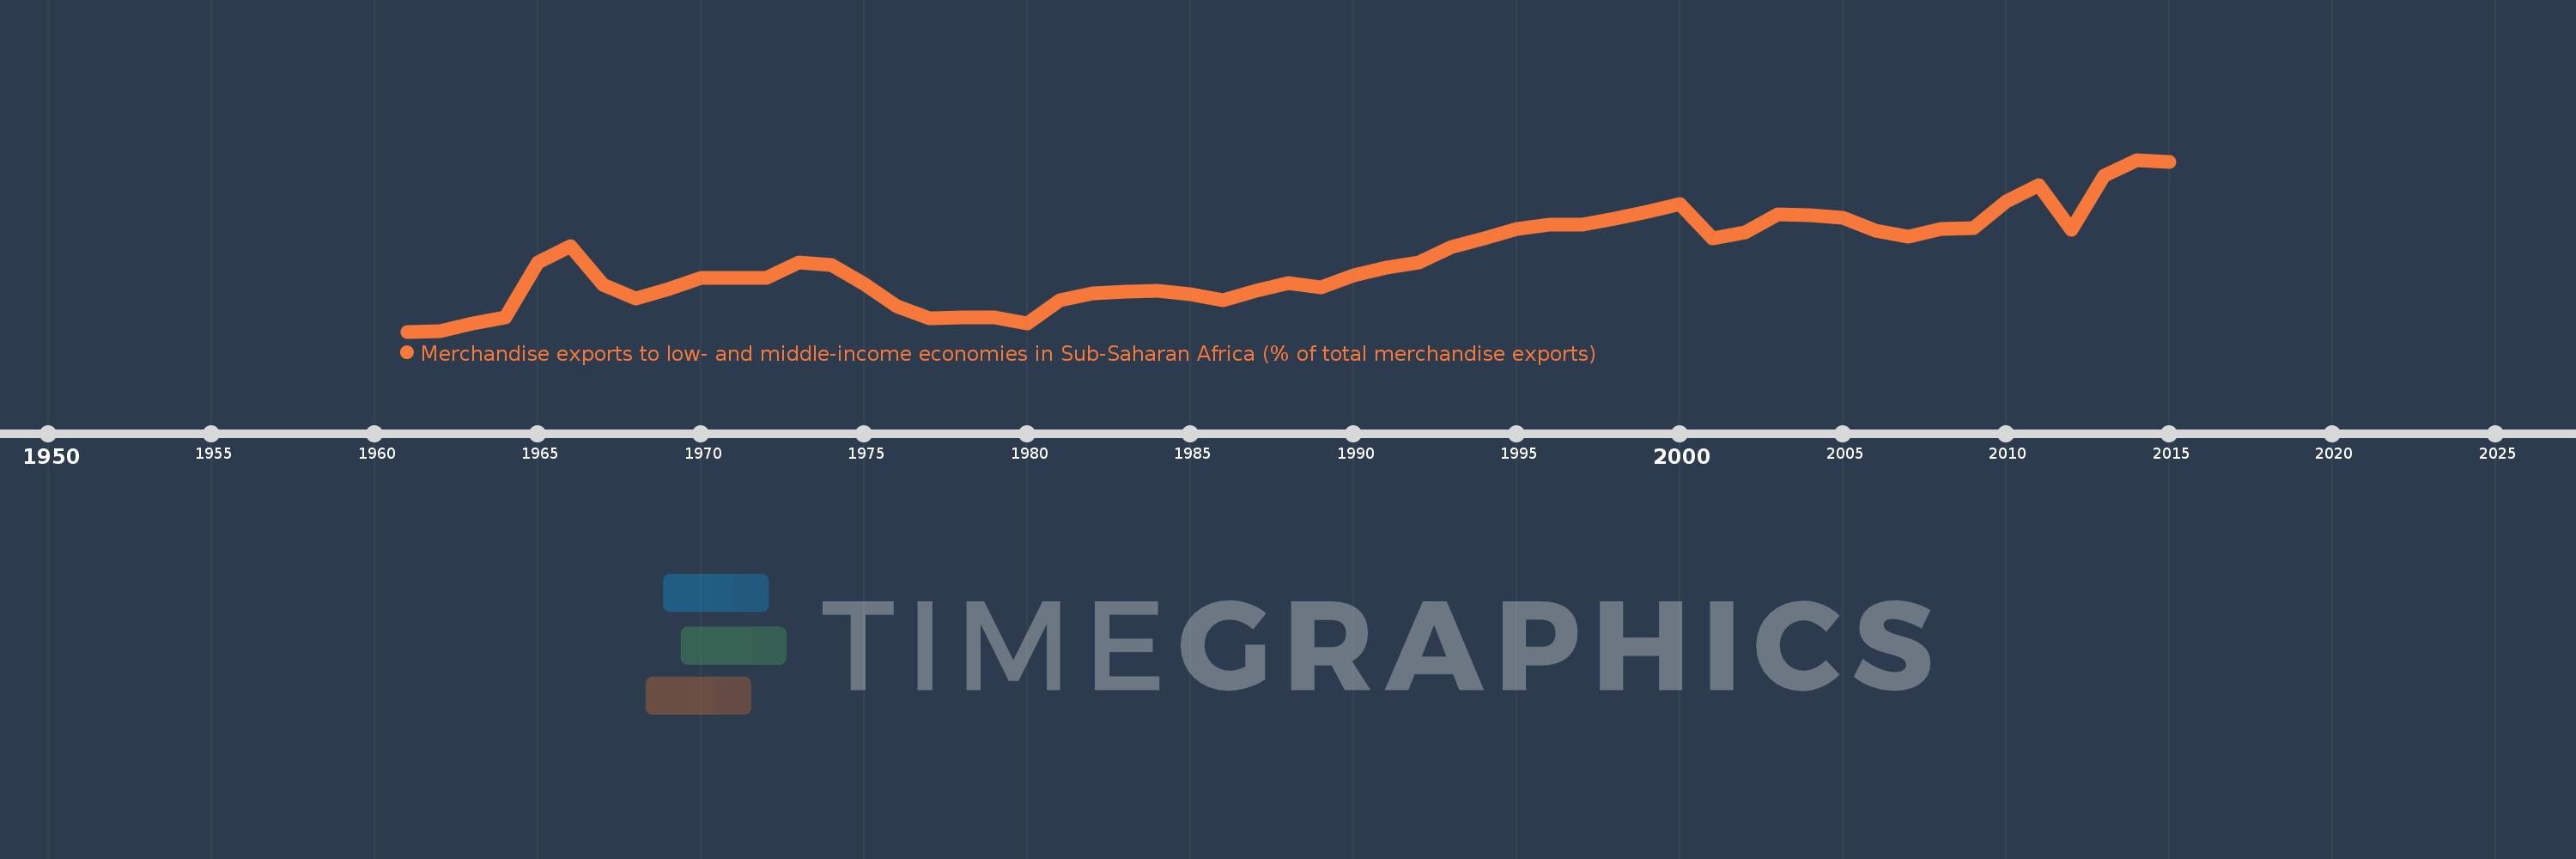
Merchandise exports to low- and middle-income economies in Sub-Saharan Africa (% of total merchandise exports)
2015,2014,2013,2012,2011,2010,2009,2008,2007,2006,2005,2004,2003,2002,2001,2000,1999,1998,1997,1996,1995,1994,1993,1992,1991,1990,1989,1988,1987,1986,1985,1984,1983,1982,1981,1980,1979,1978,1977,1976,1975,1974,1973,1972,1971,1970,1969,1968,1967,1966,1965,1964,1963,1962,1961
This statistics in other country:
AfghanistanAlbaniaAlgeriaAngolaArab WorldArgentinaArmeniaAustraliaAustriaAzerbaijanBahamas, TheBahrainBangladeshBarbadosBelarusBelgiumBelizeBeninBermudaBoliviaBrazilBulgariaBurkina FasoBurundiCabo VerdeCambodiaCameroonCanadaCaribbean small statesCentral African RepublicCentral Europe and the BalticsChadChileChinaColombiaCongo, Dem. Rep.Congo, Rep.Costa RicaCote d'IvoireCroatiaCubaCyprusCzech RepublicDenmarkDjiboutiDominicaDominican RepublicEarly-demographic dividendEast Asia & PacificEast Asia & Pacific (excluding high income)East Asia & Pacific (IDA & IBRD countries)EcuadorEgypt, Arab Rep.EstoniaEthiopiaEuro areaEurope & Central AsiaEurope & Central Asia (excluding high income)Europe & Central Asia (IDA & IBRD countries)European UnionFijiFinlandFragile and conflict affected situationsFranceGabonGambia, TheGeorgiaGermanyGhanaGibraltarGreeceGreenlandGuatemalaGuineaGuinea-BissauGuyanaHaitiHeavily indebted poor countries (HIPC)High incomeHondurasHong Kong SAR, ChinaHungaryIBRD onlyIcelandIDA & IBRD totalIDA blendIDA onlyIDA totalIndiaIndonesiaIran, Islamic Rep.IraqIrelandIsraelItalyJamaicaJapanJordanKazakhstanKenyaKorea, Dem. People’s Rep.Korea, Rep.KuwaitLao PDRLate-demographic dividendLatin America & Caribbean Latin America & Caribbean (excluding high income)Latin America & the Caribbean (IDA & IBRD countries)LatviaLeast developed countries: UN classificationLebanonLiberiaLibyaLithuaniaLow & middle incomeLow incomeLower middle incomeLuxembourgMacao SAR, ChinaMacedonia, FYRMadagascarMalawiMalaysiaMaliMaltaMauritaniaMauritiusMexicoMiddle East & North AfricaMiddle East & North Africa (excluding high income)Middle East & North Africa (IDA & IBRD countries)Middle incomeMoldovaMontenegroMoroccoMozambiqueMyanmarNetherlandsNew ZealandNicaraguaNigerNigeriaNorth AmericaNorwayOECD membersOmanOther small statesPacific island small statesPakistanPanamaPapua New GuineaParaguayPeruPhilippinesPolandPortugalPost-demographic dividendPre-demographic dividendQatarRomaniaRussian FederationRwandaSaudi ArabiaSenegalSerbiaSeychellesSierra LeoneSingaporeSlovak RepublicSloveniaSmall statesSomaliaSouth AfricaSouth AsiaSouth Asia (IDA & IBRD)SpainSri LankaSt. LuciaSt. Vincent and the GrenadinesSub-Saharan Africa Sub-Saharan Africa (excluding high income)Sub-Saharan Africa (IDA & IBRD countries)SudanSurinameSwedenSwitzerlandSyrian Arab RepublicTanzaniaThailandTogoTrinidad and TobagoTunisiaTurkeyUgandaUkraineUnited Arab EmiratesUnited KingdomUnited StatesUpper middle incomeUruguayVenezuela, RBVietnamWorldYemen, Rep.ZambiaZimbabwe Timeline:
This timeline shows a graph from 1961 to 2015 of Sub-Saharan Africa . No data until 1960. Number of actual observations by date: 55.
Source name:
World Development Indicators
Source organization:
World Bank staff estimates based data from International Monetary Fund's Direction of Trade database.
Categories, topics:
Private Sector, Trade
Last updated:
apr 23, 2017
Indicators value changes by year
Maximum:
16.575
jan 1, 2014
At the date of observation
Value
Absolute change
Change from previous value
jan 1, 1961
3.007
+3.007
0.0%
jan 1, 1962
3.051
+0.044
1.46%
jan 1, 1963
3.635
+0.584
19.13%
jan 1, 1964
4.107
+0.472
12.99%
jan 1, 1965
8.435
+4.329
105.4%
jan 1, 1966
9.739
+1.304
15.46%
jan 1, 1967
6.714
-3.026
-31.07%
jan 1, 1968
5.613
-1.101
-16.4%
jan 1, 1969
6.393
+0.781
13.91%
jan 1, 1970
7.276
+0.883
13.81%
jan 1, 1971
7.245
-0.031
-0.43%
jan 1, 1972
7.276
+0.031
0.43%
jan 1, 1973
8.449
+1.174
16.13%
jan 1, 1974
8.236
-0.214
-2.53%
jan 1, 1975
6.748
-1.488
-18.07%
jan 1, 1976
5.014
-1.733
-25.69%
jan 1, 1977
4.043
-0.971
-19.37%
jan 1, 1978
4.134
+0.092
2.26%
jan 1, 1979
4.099
-0.036
-0.87%
jan 1, 1980
3.624
-0.474
-11.58%
jan 1, 1981
5.504
+1.88
51.88%
jan 1, 1982
6.026
+0.522
9.48%
jan 1, 1983
6.16
+0.134
2.22%
jan 1, 1984
6.257
+0.097
1.57%
jan 1, 1985
5.941
-0.316
-5.05%
jan 1, 1986
5.469
-0.472
-7.95%
jan 1, 1987
6.206
+0.737
13.47%
jan 1, 1988
6.867
+0.661
10.66%
jan 1, 1989
6.47
-0.397
-5.78%
jan 1, 1990
7.484
+1.014
15.67%
jan 1, 1991
8.083
+0.599
8.01%
jan 1, 1992
8.46
+0.377
4.66%
jan 1, 1993
9.688
+1.229
14.52%
jan 1, 1994
10.385
+0.697
7.2%
jan 1, 1995
11.11
+0.724
6.97%
jan 1, 1996
11.448
+0.338
3.05%
jan 1, 1997
11.442
-0.006
-0.05%
jan 1, 1998
11.927
+0.485
4.24%
jan 1, 1999
12.492
+0.565
4.73%
jan 1, 2000
13.081
+0.589
4.72%
jan 1, 2001
10.356
-2.725
-20.83%
jan 1, 2002
10.82
+0.464
4.48%
jan 1, 2003
12.298
+1.478
13.66%
jan 1, 2004
12.196
-0.102
-0.83%
jan 1, 2005
12.027
-0.168
-1.38%
jan 1, 2006
11.012
-1.015
-8.44%
jan 1, 2007
10.535
-0.477
-4.33%
jan 1, 2008
11.092
+0.557
5.29%
jan 1, 2009
11.185
+0.093
0.84%
jan 1, 2010
13.301
+2.116
18.92%
jan 1, 2011
14.596
+1.295
9.74%
jan 1, 2012
11.044
-3.552
-24.33%
jan 1, 2013
15.322
+4.278
38.73%
jan 1, 2014
16.575
+1.253
8.18%
jan 1, 2015
16.409
-0.165
-1.0%
Ranking of countries by current statistics by years


Comments: