29
/
en
AIzaSyAYiBZKx7MnpbEhh9jyipgxe19OcubqV5w
April 1, 2024
66282
Algeria
DZA
true
2
1
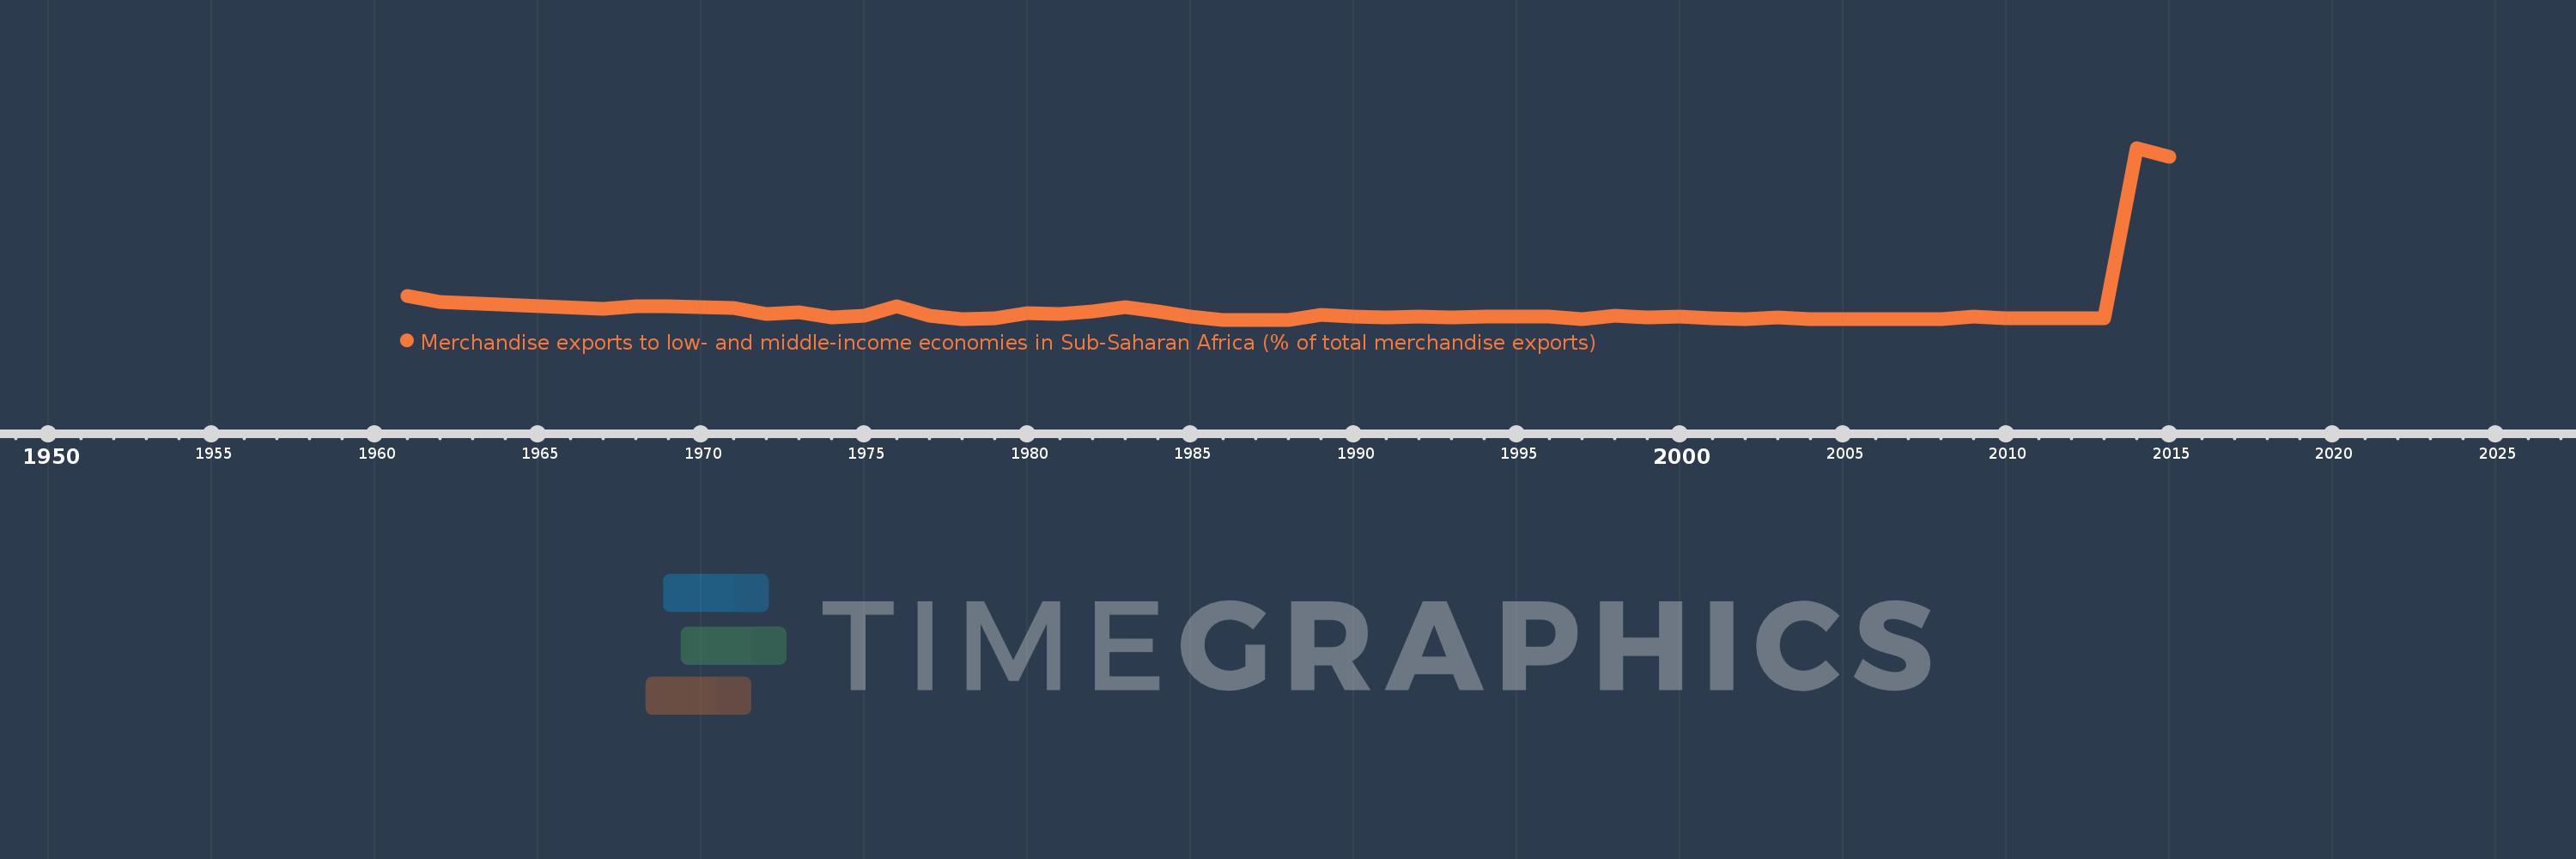
Merchandise exports to low- and middle-income economies in Sub-Saharan Africa (% of total merchandise exports)
2015,2014,2013,2012,2011,2010,2009,2008,2007,2006,2005,2004,2003,2002,2001,2000,1999,1998,1997,1996,1995,1994,1993,1992,1991,1990,1989,1988,1987,1986,1985,1984,1983,1982,1981,1980,1979,1978,1977,1976,1975,1974,1973,1972,1971,1970,1969,1968,1967,1962,1961
This statistics in other country:
AfghanistanAlbaniaAlgeriaAngolaArab WorldArgentinaArmeniaAustraliaAustriaAzerbaijanBahamas, TheBahrainBangladeshBarbadosBelarusBelgiumBelizeBeninBermudaBoliviaBrazilBulgariaBurkina FasoBurundiCabo VerdeCambodiaCameroonCanadaCaribbean small statesCentral African RepublicCentral Europe and the BalticsChadChileChinaColombiaCongo, Dem. Rep.Congo, Rep.Costa RicaCote d'IvoireCroatiaCubaCyprusCzech RepublicDenmarkDjiboutiDominicaDominican RepublicEarly-demographic dividendEast Asia & PacificEast Asia & Pacific (excluding high income)East Asia & Pacific (IDA & IBRD countries)EcuadorEgypt, Arab Rep.EstoniaEthiopiaEuro areaEurope & Central AsiaEurope & Central Asia (excluding high income)Europe & Central Asia (IDA & IBRD countries)European UnionFijiFinlandFragile and conflict affected situationsFranceGabonGambia, TheGeorgiaGermanyGhanaGibraltarGreeceGreenlandGuatemalaGuineaGuinea-BissauGuyanaHaitiHeavily indebted poor countries (HIPC)High incomeHondurasHong Kong SAR, ChinaHungaryIBRD onlyIcelandIDA & IBRD totalIDA blendIDA onlyIDA totalIndiaIndonesiaIran, Islamic Rep.IraqIrelandIsraelItalyJamaicaJapanJordanKazakhstanKenyaKorea, Dem. People’s Rep.Korea, Rep.KuwaitLao PDRLate-demographic dividendLatin America & Caribbean Latin America & Caribbean (excluding high income)Latin America & the Caribbean (IDA & IBRD countries)LatviaLeast developed countries: UN classificationLebanonLiberiaLibyaLithuaniaLow & middle incomeLow incomeLower middle incomeLuxembourgMacao SAR, ChinaMacedonia, FYRMadagascarMalawiMalaysiaMaliMaltaMauritaniaMauritiusMexicoMiddle East & North AfricaMiddle East & North Africa (excluding high income)Middle East & North Africa (IDA & IBRD countries)Middle incomeMoldovaMontenegroMoroccoMozambiqueMyanmarNetherlandsNew ZealandNicaraguaNigerNigeriaNorth AmericaNorwayOECD membersOmanOther small statesPacific island small statesPakistanPanamaPapua New GuineaParaguayPeruPhilippinesPolandPortugalPost-demographic dividendPre-demographic dividendQatarRomaniaRussian FederationRwandaSaudi ArabiaSenegalSerbiaSeychellesSierra LeoneSingaporeSlovak RepublicSloveniaSmall statesSomaliaSouth AfricaSouth AsiaSouth Asia (IDA & IBRD)SpainSri LankaSt. LuciaSt. Vincent and the GrenadinesSub-Saharan Africa Sub-Saharan Africa (excluding high income)Sub-Saharan Africa (IDA & IBRD countries)SudanSurinameSwedenSwitzerlandSyrian Arab RepublicTanzaniaThailandTogoTrinidad and TobagoTunisiaTurkeyUgandaUkraineUnited Arab EmiratesUnited KingdomUnited StatesUpper middle incomeUruguayVenezuela, RBVietnamWorldYemen, Rep.ZambiaZimbabwe Timeline:
This timeline shows a graph from 1961 to 2015 of Algeria. No data until 1960. Number of actual observations by date: 51.
Source name:
World Development Indicators
Source organization:
World Bank staff estimates based data from International Monetary Fund's Direction of Trade database.
Categories, topics:
Private Sector, Trade
Last updated:
apr 23, 2017
Indicators value changes by year
Maximum:
22.572
jan 1, 2014
At the date of observation
Value
Absolute change
Change from previous value
jan 1, 1961
3.154
+3.154
0.0%
jan 1, 1962
2.358
-0.796
-25.23%
jan 1, 1967
1.417
-0.941
-39.93%
jan 1, 1968
1.77
+0.353
24.94%
jan 1, 1969
1.722
-0.048
-2.73%
jan 1, 1970
1.603
-0.119
-6.91%
jan 1, 1971
1.509
-0.093
-5.83%
jan 1, 1972
0.795
-0.714
-47.3%
jan 1, 1973
0.973
+0.177
22.3%
jan 1, 1974
0.321
-0.651
-66.95%
jan 1, 1975
0.505
+0.183
57.02%
jan 1, 1976
1.731
+1.226
242.82%
jan 1, 1977
0.576
-1.155
-66.72%
jan 1, 1978
0.124
-0.451
-78.39%
jan 1, 1979
0.141
+0.017
13.33%
jan 1, 1980
0.815
+0.674
477.48%
jan 1, 1981
0.777
-0.038
-4.67%
jan 1, 1982
1.136
+0.359
46.29%
jan 1, 1983
1.692
+0.556
48.89%
jan 1, 1984
1.104
-0.588
-34.76%
jan 1, 1985
0.375
-0.729
-66.04%
jan 1, 1986
0.0
-0.375
-100.0%
jan 1, 1989
0.677
+0.677
%
jan 1, 1990
0.417
-0.259
-38.31%
jan 1, 1991
0.322
-0.095
-22.79%
jan 1, 1992
0.365
+0.042
13.17%
jan 1, 1993
0.252
-0.113
-30.98%
jan 1, 1994
0.426
+0.174
69.23%
jan 1, 1995
0.383
-0.043
-10.09%
jan 1, 1996
0.392
+0.009
2.25%
jan 1, 1997
0.1
-0.291
-74.42%
jan 1, 1998
0.494
+0.394
393.56%
jan 1, 1999
0.342
-0.152
-30.76%
jan 1, 2000
0.409
+0.067
19.56%
jan 1, 2001
0.244
-0.165
-40.33%
jan 1, 2002
0.131
-0.113
-46.4%
jan 1, 2003
0.321
+0.19
145.35%
jan 1, 2004
0.102
-0.22
-68.36%
jan 1, 2005
0.088
-0.014
-13.52%
jan 1, 2006
0.108
+0.02
22.49%
jan 1, 2007
0.03
-0.078
-72.03%
jan 1, 2008
0.084
+0.054
178.17%
jan 1, 2009
0.463
+0.379
452.95%
jan 1, 2010
0.21
-0.253
-54.7%
jan 1, 2011
0.228
+0.018
8.8%
jan 1, 2012
0.221
-0.007
-3.13%
jan 1, 2013
0.182
-0.039
-17.77%
jan 1, 2014
22.572
+22.39
12.31K%
jan 1, 2015
21.389
-1.183
-5.24%
Ranking of countries by current statistics by years


Comments: