29
/
en
AIzaSyAYiBZKx7MnpbEhh9jyipgxe19OcubqV5w
April 1, 2024
262539
Thailand
THA
true
2
1
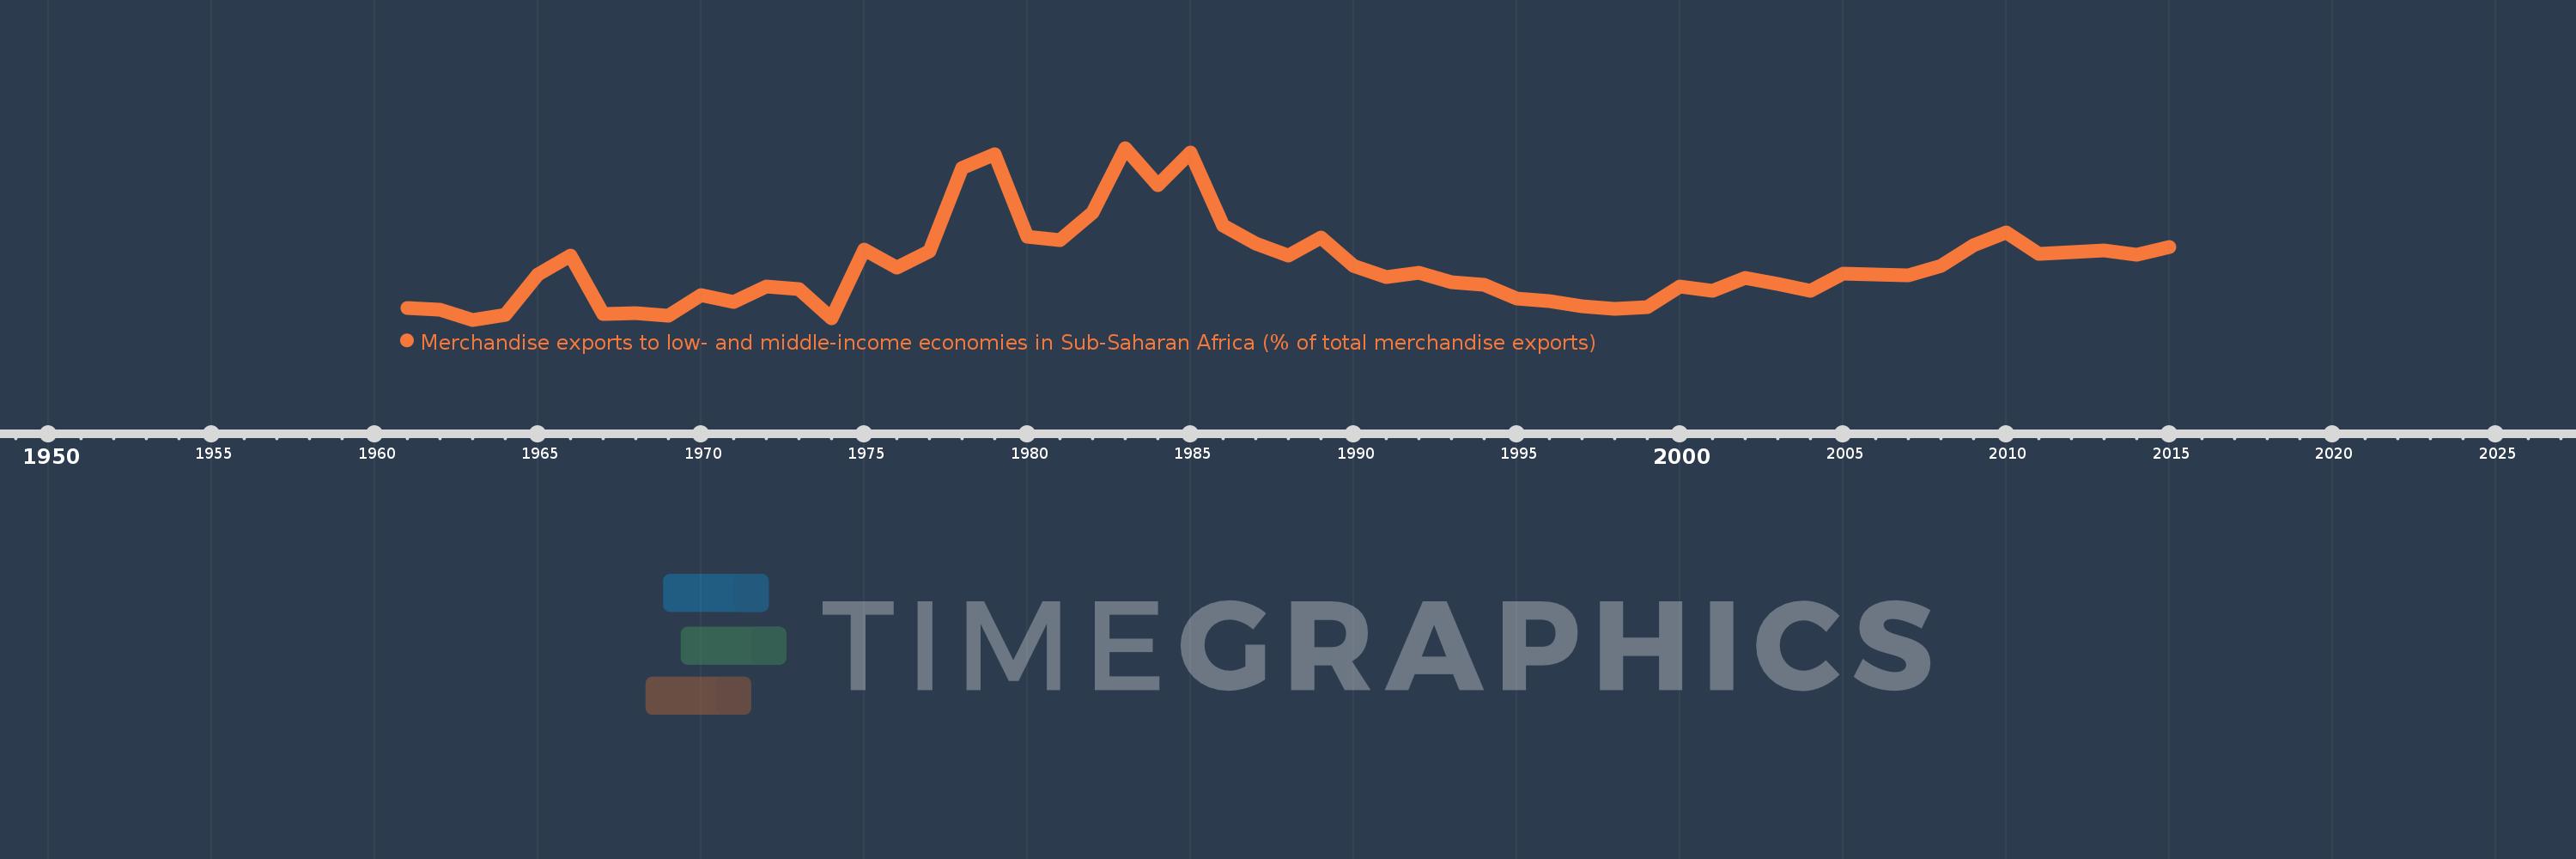
Merchandise exports to low- and middle-income economies in Sub-Saharan Africa (% of total merchandise exports)
2015,2014,2013,2012,2011,2010,2009,2008,2007,2006,2005,2004,2003,2002,2001,2000,1999,1998,1997,1996,1995,1994,1993,1992,1991,1990,1989,1988,1987,1986,1985,1984,1983,1982,1981,1980,1979,1978,1977,1976,1975,1974,1973,1972,1971,1970,1969,1968,1967,1966,1965,1964,1963,1962,1961
This statistics in other country:
AfghanistanAlbaniaAlgeriaAngolaArab WorldArgentinaArmeniaAustraliaAustriaAzerbaijanBahamas, TheBahrainBangladeshBarbadosBelarusBelgiumBelizeBeninBermudaBoliviaBrazilBulgariaBurkina FasoBurundiCabo VerdeCambodiaCameroonCanadaCaribbean small statesCentral African RepublicCentral Europe and the BalticsChadChileChinaColombiaCongo, Dem. Rep.Congo, Rep.Costa RicaCote d'IvoireCroatiaCubaCyprusCzech RepublicDenmarkDjiboutiDominicaDominican RepublicEarly-demographic dividendEast Asia & PacificEast Asia & Pacific (excluding high income)East Asia & Pacific (IDA & IBRD countries)EcuadorEgypt, Arab Rep.EstoniaEthiopiaEuro areaEurope & Central AsiaEurope & Central Asia (excluding high income)Europe & Central Asia (IDA & IBRD countries)European UnionFijiFinlandFragile and conflict affected situationsFranceGabonGambia, TheGeorgiaGermanyGhanaGibraltarGreeceGreenlandGuatemalaGuineaGuinea-BissauGuyanaHaitiHeavily indebted poor countries (HIPC)High incomeHondurasHong Kong SAR, ChinaHungaryIBRD onlyIcelandIDA & IBRD totalIDA blendIDA onlyIDA totalIndiaIndonesiaIran, Islamic Rep.IraqIrelandIsraelItalyJamaicaJapanJordanKazakhstanKenyaKorea, Dem. People’s Rep.Korea, Rep.KuwaitLao PDRLate-demographic dividendLatin America & Caribbean Latin America & Caribbean (excluding high income)Latin America & the Caribbean (IDA & IBRD countries)LatviaLeast developed countries: UN classificationLebanonLiberiaLibyaLithuaniaLow & middle incomeLow incomeLower middle incomeLuxembourgMacao SAR, ChinaMacedonia, FYRMadagascarMalawiMalaysiaMaliMaltaMauritaniaMauritiusMexicoMiddle East & North AfricaMiddle East & North Africa (excluding high income)Middle East & North Africa (IDA & IBRD countries)Middle incomeMoldovaMontenegroMoroccoMozambiqueMyanmarNetherlandsNew ZealandNicaraguaNigerNigeriaNorth AmericaNorwayOECD membersOmanOther small statesPacific island small statesPakistanPanamaPapua New GuineaParaguayPeruPhilippinesPolandPortugalPost-demographic dividendPre-demographic dividendQatarRomaniaRussian FederationRwandaSaudi ArabiaSenegalSerbiaSeychellesSierra LeoneSingaporeSlovak RepublicSloveniaSmall statesSomaliaSouth AfricaSouth AsiaSouth Asia (IDA & IBRD)SpainSri LankaSt. LuciaSt. Vincent and the GrenadinesSub-Saharan Africa Sub-Saharan Africa (excluding high income)Sub-Saharan Africa (IDA & IBRD countries)SudanSurinameSwedenSwitzerlandSyrian Arab RepublicTanzaniaThailandTogoTrinidad and TobagoTunisiaTurkeyUgandaUkraineUnited Arab EmiratesUnited KingdomUnited StatesUpper middle incomeUruguayVenezuela, RBVietnamWorldYemen, Rep.ZambiaZimbabwe Timeline:
This timeline shows a graph from 1961 to 2015 of Thailand. No data until 1960. Number of actual observations by date: 55.
Source name:
World Development Indicators
Source organization:
World Bank staff estimates based data from International Monetary Fund's Direction of Trade database.
Categories, topics:
Private Sector, Trade
Last updated:
apr 23, 2017
Indicators value changes by year
At the date of observation
Value
Absolute change
Change from previous value
jan 1, 1961
1.017
+1.017
0.0%
jan 1, 1962
0.952
-0.065
-6.39%
jan 1, 1963
0.651
-0.301
-31.59%
jan 1, 1964
0.799
+0.148
22.75%
jan 1, 1965
2.03
+1.231
153.96%
jan 1, 1966
2.628
+0.598
29.44%
jan 1, 1967
0.827
-1.801
-68.54%
jan 1, 1968
0.849
+0.022
2.71%
jan 1, 1969
0.764
-0.085
-10.04%
jan 1, 1970
1.407
+0.643
84.2%
jan 1, 1971
1.203
-0.204
-14.51%
jan 1, 1972
1.681
+0.478
39.74%
jan 1, 1973
1.591
-0.09
-5.37%
jan 1, 1974
0.686
-0.905
-56.9%
jan 1, 1975
2.797
+2.111
307.99%
jan 1, 1976
2.253
-0.543
-19.43%
jan 1, 1977
2.752
+0.498
22.11%
jan 1, 1978
5.307
+2.556
92.88%
jan 1, 1979
5.707
+0.399
7.53%
jan 1, 1980
3.187
-2.52
-44.16%
jan 1, 1981
3.082
-0.105
-3.31%
jan 1, 1982
3.931
+0.849
27.55%
jan 1, 1983
5.909
+1.978
50.33%
jan 1, 1984
4.764
-1.145
-19.38%
jan 1, 1985
5.757
+0.994
20.86%
jan 1, 1986
3.544
-2.214
-38.45%
jan 1, 1987
2.98
-0.564
-15.91%
jan 1, 1988
2.608
-0.372
-12.48%
jan 1, 1989
3.175
+0.567
21.74%
jan 1, 1990
2.307
-0.868
-27.33%
jan 1, 1991
1.963
-0.344
-14.92%
jan 1, 1992
2.084
+0.121
6.18%
jan 1, 1993
1.811
-0.273
-13.11%
jan 1, 1994
1.717
-0.095
-5.22%
jan 1, 1995
1.289
-0.427
-24.9%
jan 1, 1996
1.225
-0.064
-4.94%
jan 1, 1997
1.051
-0.174
-14.23%
jan 1, 1998
0.976
-0.075
-7.16%
jan 1, 1999
1.045
+0.069
7.1%
jan 1, 2000
1.656
+0.611
58.44%
jan 1, 2001
1.546
-0.11
-6.63%
jan 1, 2002
1.927
+0.381
24.66%
jan 1, 2003
1.737
-0.19
-9.86%
jan 1, 2004
1.54
-0.198
-11.38%
jan 1, 2005
2.054
+0.514
33.39%
jan 1, 2006
2.04
-0.013
-0.66%
jan 1, 2007
2.002
-0.038
-1.86%
jan 1, 2008
2.295
+0.293
14.63%
jan 1, 2009
2.928
+0.633
27.57%
jan 1, 2010
3.314
+0.386
13.17%
jan 1, 2011
2.669
-0.645
-19.46%
jan 1, 2012
2.732
+0.063
2.38%
jan 1, 2013
2.76
+0.027
1.0%
jan 1, 2014
2.648
-0.111
-4.03%
jan 1, 2015
2.877
+0.229
8.64%
Ranking of countries by current statistics by years


Comments: